If you learned Next.js 10,514 before version 16, you remember a build table with Size and First Load JS columns. Those are gone: the JS bundle size metrics were removed from next build in 16.0, leaving a map of how each route is served.
Route (app)
┌ ○ /
├ ○ /_not-found
├ ƒ /api/vitals
├ ○ /fast
├ ƒ /live
└ ○ /slow
○  (Static)   prerendered as static content
ƒ  (Dynamic)  server-rendered on demand
Read that table first, because rendering mode dominates TTFB. /live is ƒ because it awaits headers(); the catalog routes are ○ because nothing in them touches the request. Two more symbols appear elsewhere: ● for pages prerendered from generateStaticParams, and ◐ for a partially prerendered route whose shell ships at once while the rest streams - the normal case with Cache Components (Caching and Revalidation).
For sizes, Next.js 16.1 added an analyzer built on Turbopack 10,514 's module graph. npx next experimental-analyze opens an interactive treemap on port 4000; --output writes the report to .next/diagnostics/analyze instead, to keep for a before-and-after comparison.
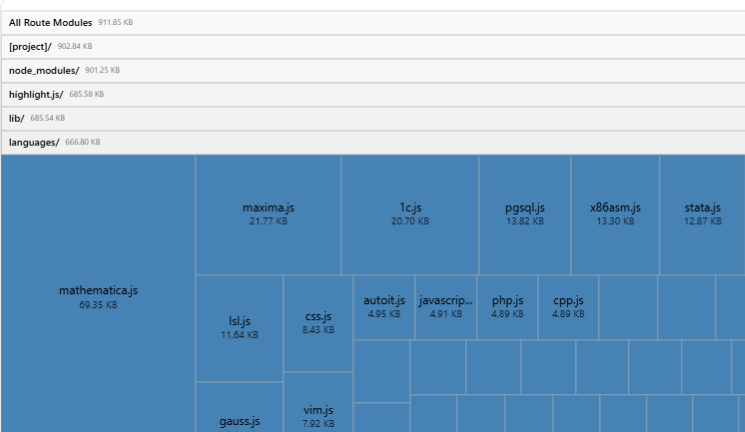
Of 2.45 MB of uncompressed client modules on /slow, highlight.js 24,999 accounts for 685.58 KB, and 666.80 KB of that is lib/languages/: Mathematica at 69.35 KB, Maxima at 21.77 KB, and roughly 190 more grammars this page will never use. Clicking a rectangle shows the import chain, so you can see which client component dragged the module across the boundary. Treat "compressed (estimated)" as a guide only: it reported 911.85 KB for /slow, while the browser downloaded 445,435 bytes.
The older @next/bundle-analyzer plugin still works, but only under next build --webpack; that build served 444,355 bytes for /slow against Turbopack's 445,435, so the two agree on the diagnosis. When a package exports hundreds of modules - icon sets, utility bundles - list it in experimental.optimizePackageImports, so only the modules you name are pulled in.