MENU
PerformanceObserver
Progressive Web Apps enable developers to build a new class of applications that deliver reliable, high-performance user experiences. But to be sure a web app is achieving its desired performance goals, developers need access to high-resolution performance measurement data. The W3C Performance Timeline specification defines such an interface for browsers to provide programmatic access to low-level timing data. This opens the door to some interesting use cases:
- offline and custom performance analysis
- third party performance analysis and visualization tools
- performance assessment integrated into IDEs and other developer tools
Access to this kind of timing data is already available in most major browsers for navigation timing, resource timing, and user timing. The performance observer interface is essentially a streaming interface to gather low-level timing information asynchronously, as it is gathered by the browser. This new interface provides several critical advantages over previous methods to access the timeline:
RESETRUNFULL
<!DOCTYPE html><html><head>
   <script>
      var observer = new PerformanceObserver(list => {
         list.getEntries().forEach(entry => {
            document.querySelector("p").innerHTML =
                "Name: " + entry.name +
                ", Type: " + entry.entryType +
                ", Start: " + entry.startTime +
                ", Duration: " + entry.duration + "<br/>";
         })
      });
      observer.observe({entryTypes: ['resource', 'mark', 'measure']});
      performance.mark('registered-observer');
      function clicked(elem) {
         performance.measure('button clicked');
      }
   </script>
</head><body>
   <button onclick="clicked(this)">Measure</button>
   <p></p>
</body></html>
The available entry types are:
frame - URL
The document's address.The PerformanceFrameTiming interface provides frame timing data about the browser's event loop. A frame represents the amount of work a browser does in one event loop iteration such as processing DOM events, resizing, scrolling, rendering, CSS animations, etc. A frame rate of 60 fps (frames per second) for a 60 Hz refresh rate is a common target for a good responsive user experience. This means the browser should process a frame in about 16.7 ms.
navigation - URL
The document's address.
resource - URL
The resolved URL of the requested resource. This value does not change even if the request is redirected.The Resource Timing interfaces enable retrieving and analyzing detailed network timing data regarding the loading of an application's resource(s). An application can use the timing metrics to determine, for example, the length of time it takes to load a specific resource, such as an XMLHttpRequest, SVG, image, or script.
mark -- String, performance.mark()
The name used when the mark was created by calling performance.mark().
measure -- String, performance.measure()
The name used when the measure was created by calling performance.measure().
paint - String
Either 'first-paint' or 'first-contentful-paint'.longtask - StringThis reports instances of long tasks.
RESETRUNFULL
<!DOCTYPE html><html><body><script>
performance.mark('a');
setTimeout(function() {
  performance.mark('b');
  setTimeout(function() {
     console.log(performance.measure("measure a to b", 'a','b'));
     console.log(performance.measure("measure a to now", 'a'));
     console.log(performance.measure("measure from navigation start to b", undefined, 'b'));
     console.log(performance.measure("measure from the start of navigation to now"));
     console.log(performance.now());               // 2030.2500000034343 (since time origin)
     console.log(performance.timeOrigin);          // 1598660536344.507
     console.log(performance.getEntries());
     console.log(performance.getEntriesByType("measure"));
     console.log(performance.getEntriesByName("measure a to b", "measure"));
     console.log(performance.toJSON());
     console.log(performance.getEntriesByName("measure a to b", "measure")[0].duration);     // 1000.8450000023004
     console.log(performance.timing.responseEnd - performance.timing.requestStart);          // 4 (20+ events)
     console.log(performance.navigation.redirectCount);    //0
     performance.clearMarks();
     performance.clearMeasures();
     //performance.setResourceTimingBufferSize(150);
     //performance.clearResourceTimeings();
     // for entryType 'resource'
  }, 1000);
}, 1000);
</script></body></html>performance.memory.usedJSHeapSize / performance.memory.jsHeapSizeLimitChrome provides the Performance and Memory tools which can be seen by pressing F12.
img = performance.getEntriesByName("/shared/sample.mp4");
var dns = parseInt(img.domainLookupEnd - img.domainLookupStart),
tcp = parseInt(img.connectEnd - img.connectStart),
ttfb = parseInt(img.responseStart - img.startTime),
transfer = parseInt(img.responseEnd - img.responseStart),
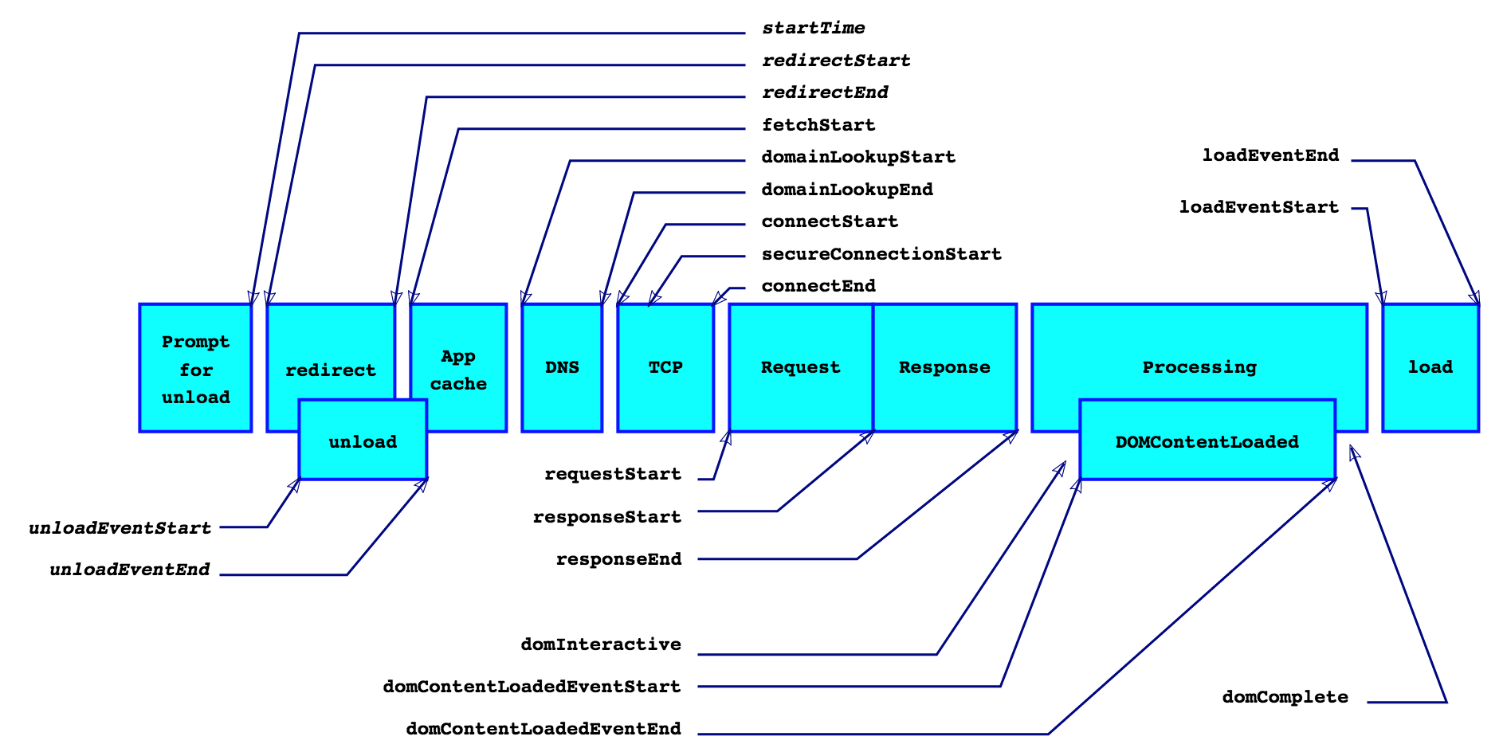
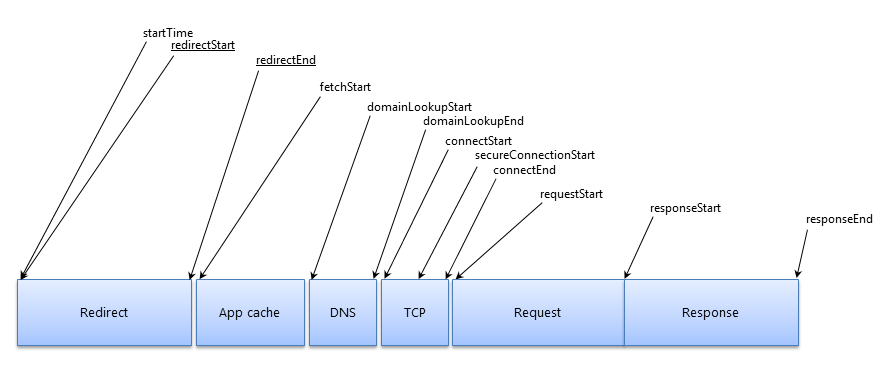
total = parseInt(img.responseEnd - img.startTime);Resource Timing
Navigation Timing