Run node --cpu-prof --cpu-prof-name=slow.cpuprofile slow.mjs and V8 86,723 samples the stack every 1000 microseconds (--cpu-prof-interval changes that), writing a .cpuprofile on exit. Sampling, not instrumentation: overhead is a fixed tick, and a function absent from every sample never ran long enough to matter. Stable since Node 22.4.0.
The file is JSON with three interesting arrays: nodes, one per unique call frame; samples, the id of the frame on top of the stack at each tick; and timeDeltas, microseconds since the previous tick. Self time per function is a dozen lines of arithmetic away.
import { readFile } from 'node:fs/promises';
const p = JSON.parse(await readFile(process.argv[2], 'utf8'));
const byId = new Map(p.nodes.map((n) => [n.id, n]));
const self = new Map();
p.samples.forEach((id, i) => {
  const { functionName, url, lineNumber } = byId.get(id).callFrame;
  const key = `${functionName || '(anonymous)'} ${url.split('/').pop()}:${lineNumber + 1}`;
  self.set(key, (self.get(key) ?? 0) + (p.timeDeltas[i] ?? 0) / 1000);
});
const all = [...self.values()].reduce((a, b) => a + b, 0);
for (const [k, t] of [...self].sort((a, b) => b[1] - a[1]).slice(0, 5)) {
  const pct = (100 * t / all).toFixed(1).padStart(5);
  console.log(`${t.toFixed(1).padStart(7)} ms ${pct}%  ${k}`);
}719.9 ms 50.8% hash slow.mjs:2 276.7 ms 19.5% slugify slow.mjs:11 210.6 ms 14.9% buildIndex slow.mjs:15 136.8 ms 9.7% (garbage collector) :0 17.8 ms 1.3% (anonymous) slow.mjs:1
Half the run is one six-line hash loop; a tenth is garbage collection of the strings slugify allocates. Those two numbers decide what to fix.
A flame graph shows the same data with the call stack restored: each box is a frame, its width is the share of samples in which it was on the stack, and boxes stack upward on their caller. The x axis is not time — siblings are sorted by name so two runs can be compared. Look for wide plateaus near the top.
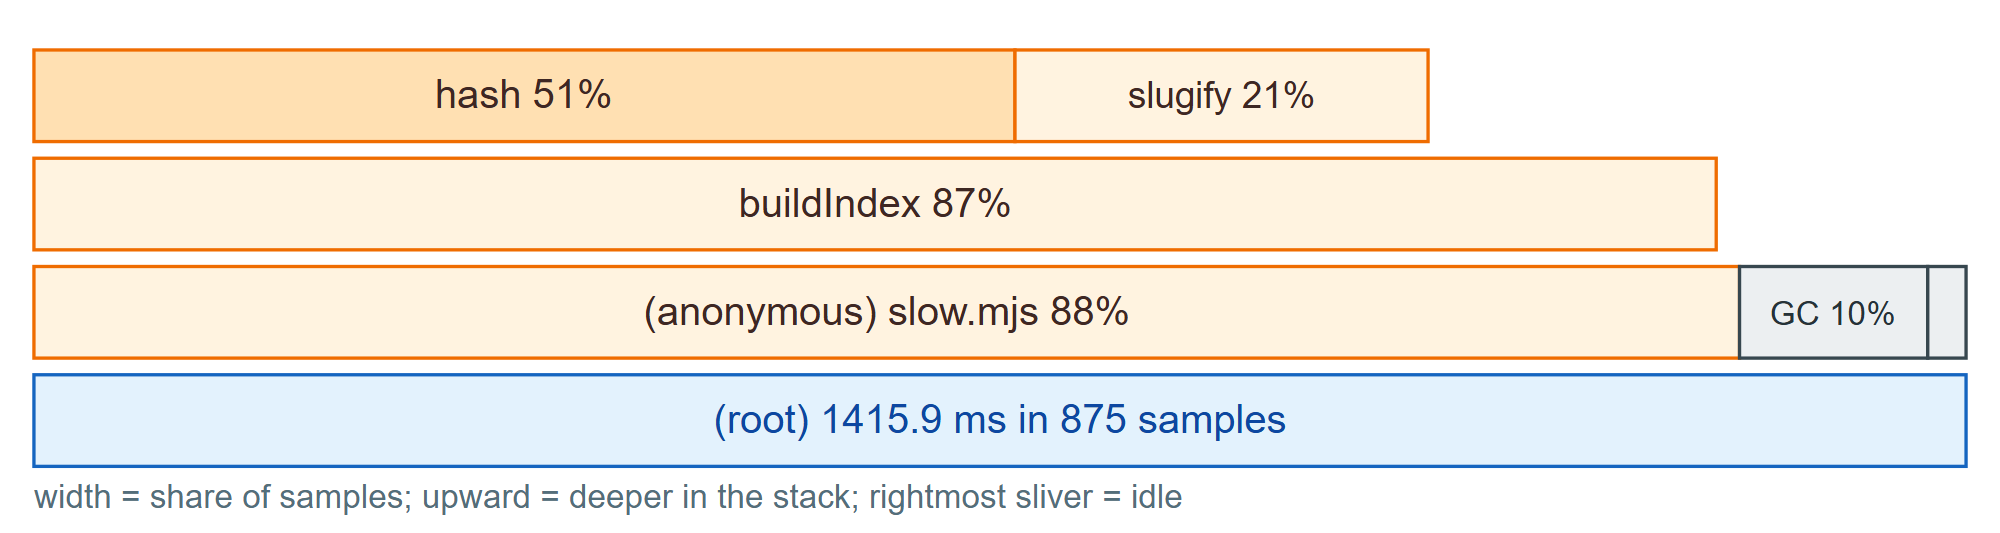
The DevTools Profiler panel opens a .cpuprofile directly, and so does speedscope 6,763 (https://github.com/jlfwong/speedscope 6,763 ) (MIT, npx speedscope slow.cpuprofile), whose "left heavy" view merges identical stacks. 0x (https://github.com/davidmarkclements/0x 3,550 ) (MIT, npx 0x app.js) and clinic flame from Clinic.js 5,954 (https://github.com/clinicjs/node-clinic 5,954 ) run the process and write the graph as a page. On a process already running, Profiler.start and Profiler.stop over the inspector protocol collect a profile with no restart.