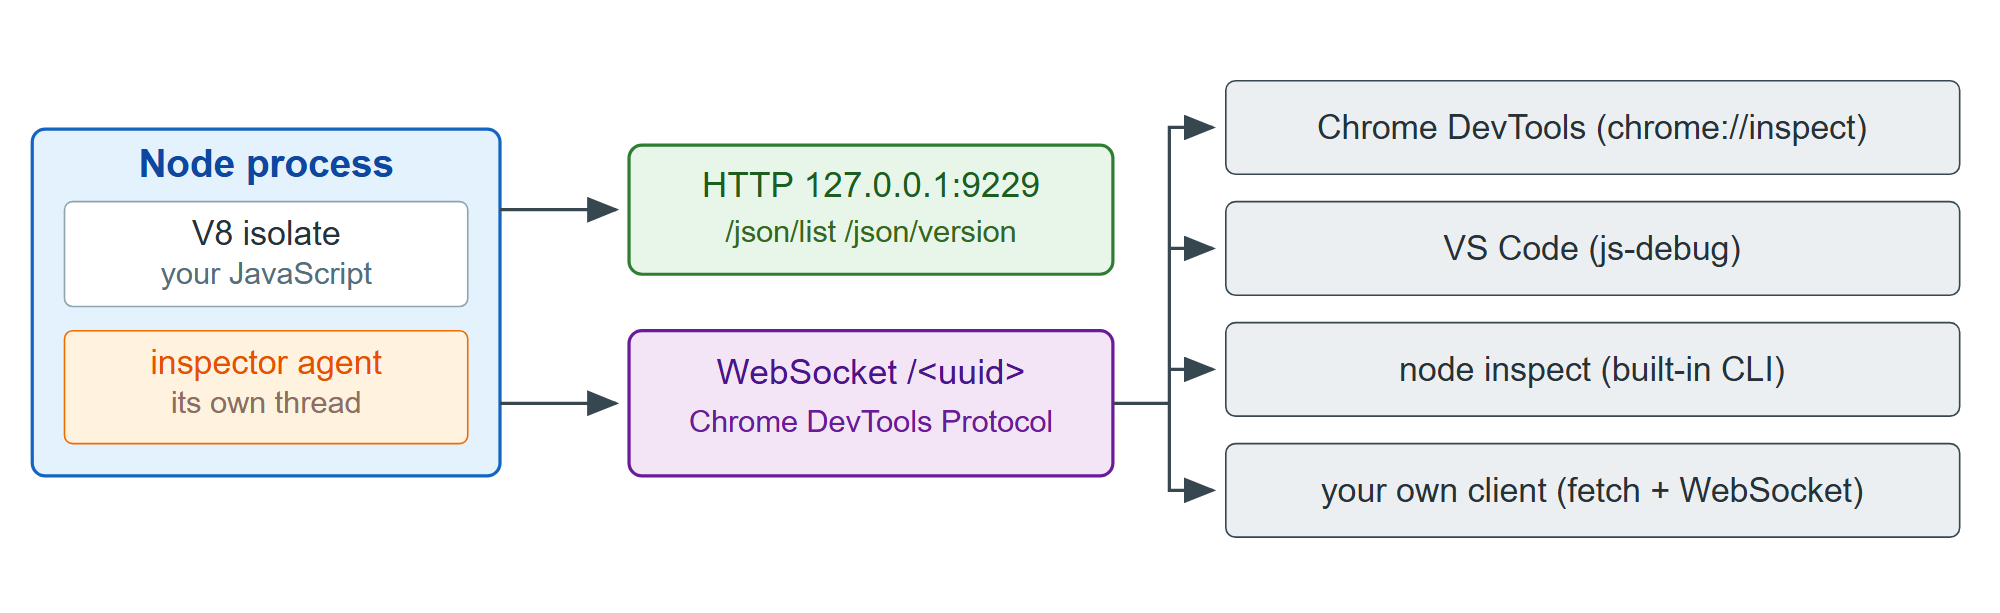
Start Node with --inspect and the process opens an HTTP and WebSocket server on 127.0.0.1:9229, printing the WebSocket URL to stderr:
$ node --inspect-wait=9230 cart.mjs
Debugger listening on ws://127.0.0.1:9230/275a0132-04f6-4c34-be04-414caf794688
For help, see: https://nodejs.org/en/docs/inspector
The UUID is a per-process secret, so a stray connection cannot drive your debugger; clients discover it from http://127.0.0.1:9229/json/list. The agent runs on its own thread, which is why you can attach to a process stuck in an infinite loop and still get a stack out. --inspect-brk breaks before the first line of user code; --inspect-wait, used above, starts nothing until a client attaches; on POSIX kill -USR1 <pid> opens the inspector on a process already running.
In Chrome 1 , open chrome://inspect and inspect the target under Remote Target: the dedicated DevTools window for Node gives you Sources with breakpoints, a Console that evaluates in the paused frame, Memory for heap snapshots and Profiler for CPU profiles. No Elements panel, because there is no document.
Everything those panels do travels over that one WebSocket as JSON, so you can speak the protocol yourself. Twelve lines over the global fetch and WebSocket give you send(method, params), which posts { id, method, params } and resolves with the matching reply, and wait(event). The session is five calls:
await send('Debugger.enable');
await send('Debugger.setBreakpointByUrl', { lineNumber: 15, urlRegex: 'cart\\.mjs$' });
const paused = wait('Debugger.paused');
await send('Runtime.runIfWaitingForDebugger');
const frame = (await paused).callFrames[0];
const { result } = await send('Debugger.evaluateOnCallFrame', { callFrameId: frame.callFrameId,
  expression: '"code=" + code + " rate=" + rate + " keys=" + Object.keys(table)' });
console.log(`paused in ${frame.functionName}() line ${frame.location.lineNumber + 1}`);
console.log(`locals: ${result.value}`);
await send('Debugger.resume');paused in applyDiscount() line 16 locals: code=save10 rate=undefined keys=SAVE10,SAVE25
The target had printed total cents: NaN. The coupon arrived as 'save10', the table is keyed in upper case, so rate was undefined and cents * (1 - undefined) is NaN. That is the shape of debugger work: stop where the value is born, not where the symptom shows.