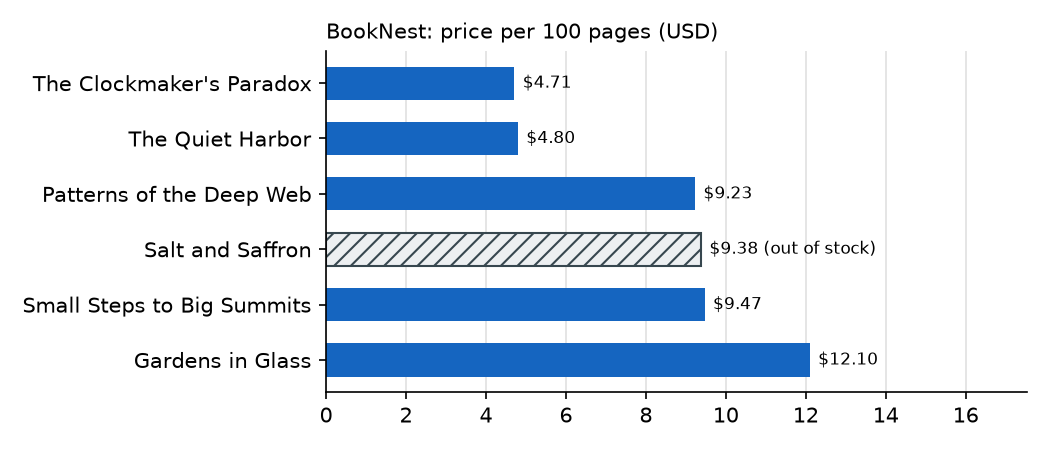
The last step serves the answer. The DuckDB 61,228 Python package runs the same SQL and hands the rows to matplotlib, which renders a PNG that can go into a report or onto a dashboard. The out-of-stock book stays in the chart but is marked with a hatch pattern and a label rather than a second color, so the chart reads in grayscale too:
# Step 4: run the query from Python and chart the result as a PNG.
import duckdb
import matplotlib
matplotlib.use("Agg")                      # render to a file; no display needed
import matplotlib.pyplot as plt
rows = duckdb.sql("""
    SELECT title, in_stock, round(price / pages * 100, 2) AS cost
    FROM 'books.parquet' ORDER BY cost DESC""").fetchall()
titles, stocked, costs = zip(*rows)
fig, ax = plt.subplots(figsize=(7, 3), dpi=150)
bars = ax.barh(titles, costs, height=0.6, color="#1565c0")
for bar, ok in zip(bars, stocked):
    if not ok:                             # out of stock: hatched gray, not a second color
        bar.set(facecolor="#eceff1", edgecolor="#37474f", hatch="///", hatchcolor="#37474f")
ax.bar_label(bars, labels=[f"${c:.2f}" + ("" if ok else " (out of stock)")
                           for c, ok in zip(costs, stocked)], padding=4, fontsize=8)
ax.set_title("BookNest: price per 100 pages (USD)", fontsize=10, loc="left")
ax.set_xlim(0, max(costs) * 1.45)
ax.xaxis.grid(True, color="#e0e0e0"); ax.set_axisbelow(True)
ax.spines[["top", "right"]].set_visible(False)
fig.tight_layout()
fig.savefig("books-value.png")
print("wrote books-value.png,", fig.get_size_inches() * fig.dpi, "pixels")wrote books-value.png, [1050. 450.] pixels
That is a complete pipeline: extract, convert, transform, serve. It is also a fragile one, and each weakness names a later chapter. The real catalog arrives as XML (XML and Its Toolchain). Types, encodings and file layouts deserve rules (JSON, Columnar and Binary Formats). Sales history needs a modeled mart (Analytical SQL and Data Warehouses), big data a cluster (Batch Processing with Apache Spark), and live orders a stream (Apache Kafka and Managed Cloud Kafka). The scripts ran in the right order only because you typed them in that order: Orchestration and Pipelines schedules, retries and tests steps like these, and Lakehouses, Data Quality and Governance adds table formats, quality checks and governance, ending with The Capstone's run of the full BookNest platform.