Dimensional modeling, popularized by Ralph Kimball, organizes analytical data as facts and dimensions. A fact table records measurable events at a declared grain, such as one row per book per order, with numeric measures like quantity and revenue. Dimension tables describe the context: which book, which customer, which date. Arranged around the fact table, they form a star schema that analysts can query with simple joins and that BI tools understand.
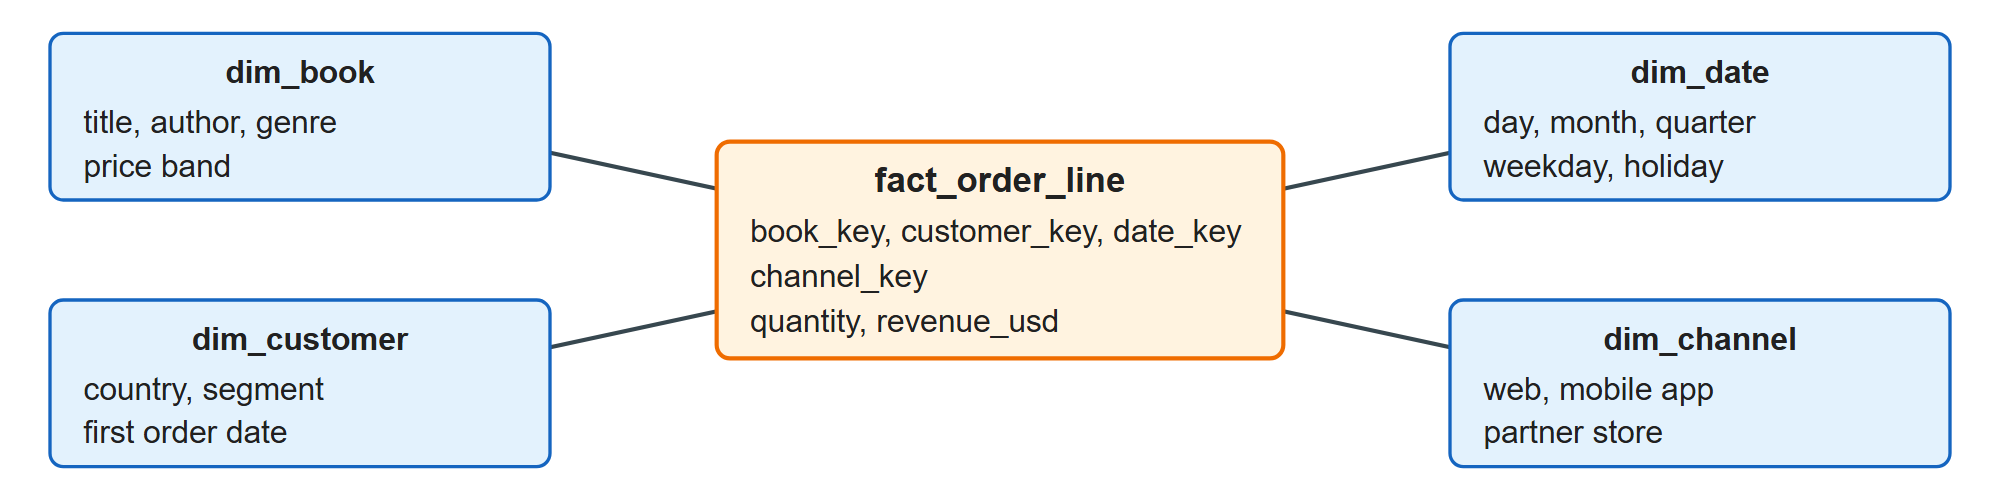
Dimensions are deliberately denormalized: dim_book repeats the genre name on every book row, trading a little storage for fewer joins. Dimensions also need a policy for change. If a book moves from "Technology" to "Science", should last year's sales move too? Slowly changing dimensions answer that (Slowly Changing Dimensions).
Data Vault, created by Dan Linstedt, targets a different problem: integrating many changing sources while keeping a full, auditable history. It splits data into hubs (business keys, such as an ISBN), links (relationships between keys, such as order to book) and satellites (descriptive attributes with load timestamps). Rows are only ever inserted, so nothing is lost and new sources are added without redesign. The price is many tables and complex queries, so a Data Vault usually sits underneath, with star schemas built on top for consumers. Dimensional Modeling and Slowly Changing Dimensions compare these approaches in depth.