The Elements panel shows the DOM React 7,897 produced, which is the wrong level of detail: it cannot say which component rendered a node, what props it received or what its state is. React Developer Tools 7,897 , the official extension, adds two tabs — Components and Profiler — that work at the level you write in. Install it from the Chrome Web Store 1 , Firefox Add-ons 102 or the Edge add-ons site; for React Native 36,878 and other non-browser targets, npx react-devtools opens the same interface as a standalone app.
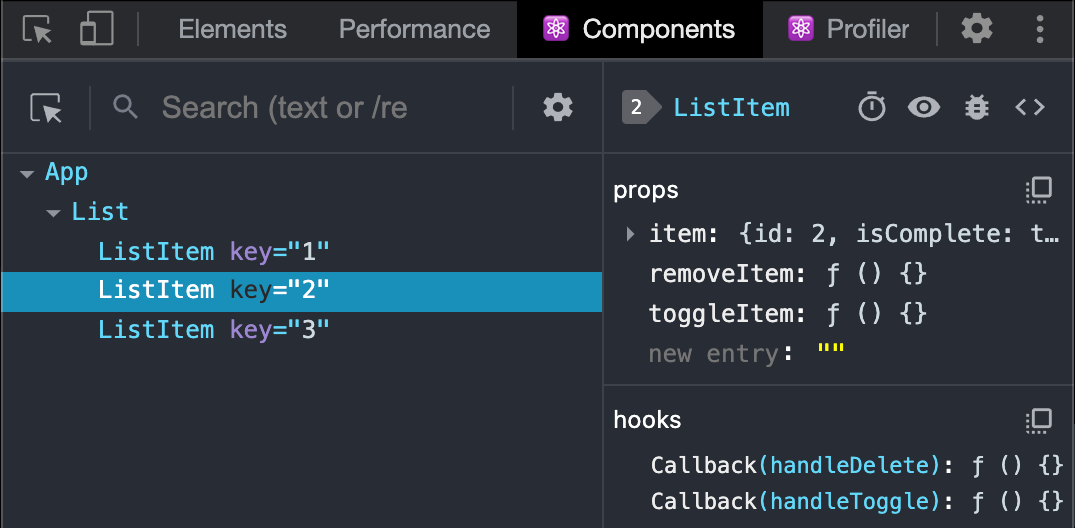
Select a node in the component tree and the right-hand pane lists its props, state and hooks in order, all editable: change a prop and the component re-renders immediately, the fastest way to check an empty state or an error branch without touching code. The eye icon reveals the matching DOM node in the Elements panel, <> jumps to the source, and the bug icon logs props and state to the console.
The Profiler tab records a session and reports, per commit, which components re-rendered and how long they took. Measuring Before Optimizing uses it properly; for now, turn on Highlight updates when components render in the settings gear and click around. Boxes flashing around parts of the screen that did not change mean some state lives too high in the tree.