The SQL tab draws the physical plan of each query as a graph, annotated with metrics collected while it ran. Blue boxes are whole-stage code generation blocks (Tungsten and Code Generation) with their codegen ID and total time; edges carry row counts.
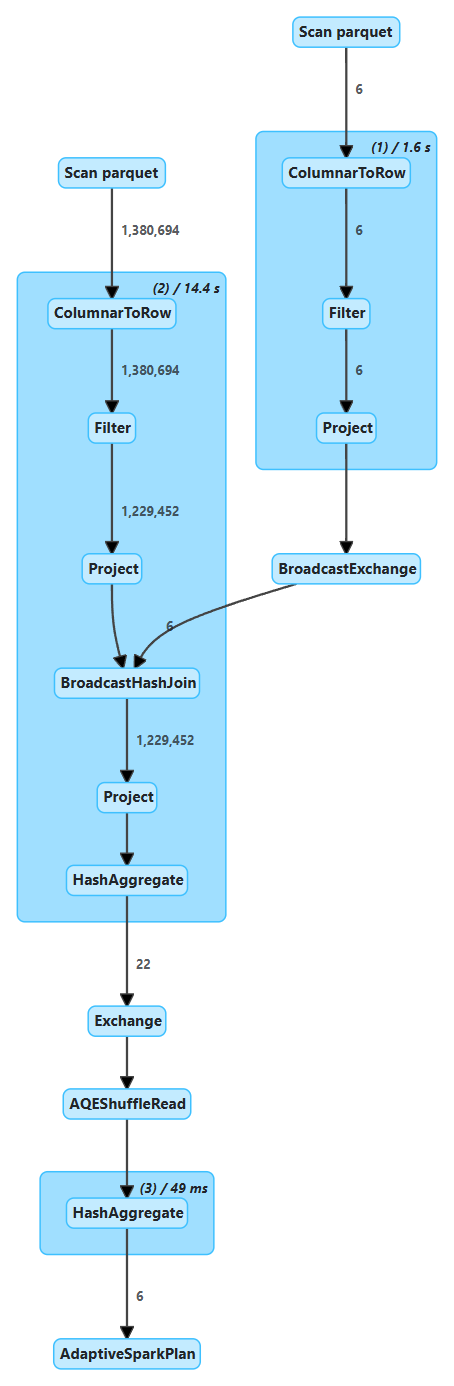
The graph confirms what the code intended: 1,380,694 rows scanned, 1,229,452 left after the status filter, the 6-row catalog broadcast into the join, and only 22 partial-aggregate rows crossing the Exchange (four tasks times up to six genres), so the shuffle cost nothing. Block (2) took 14.4 s of task time and block (3) 49 ms: optimize the former. Clicking a node expands detailed metrics, such as spill size and peak memory. The Jobs and Stages pages draw the same work as a DAG of stages (Jobs, Stages and Shuffles shows one): it tells you where the shuffle boundaries are, while the SQL graph tells you which operator did the work.