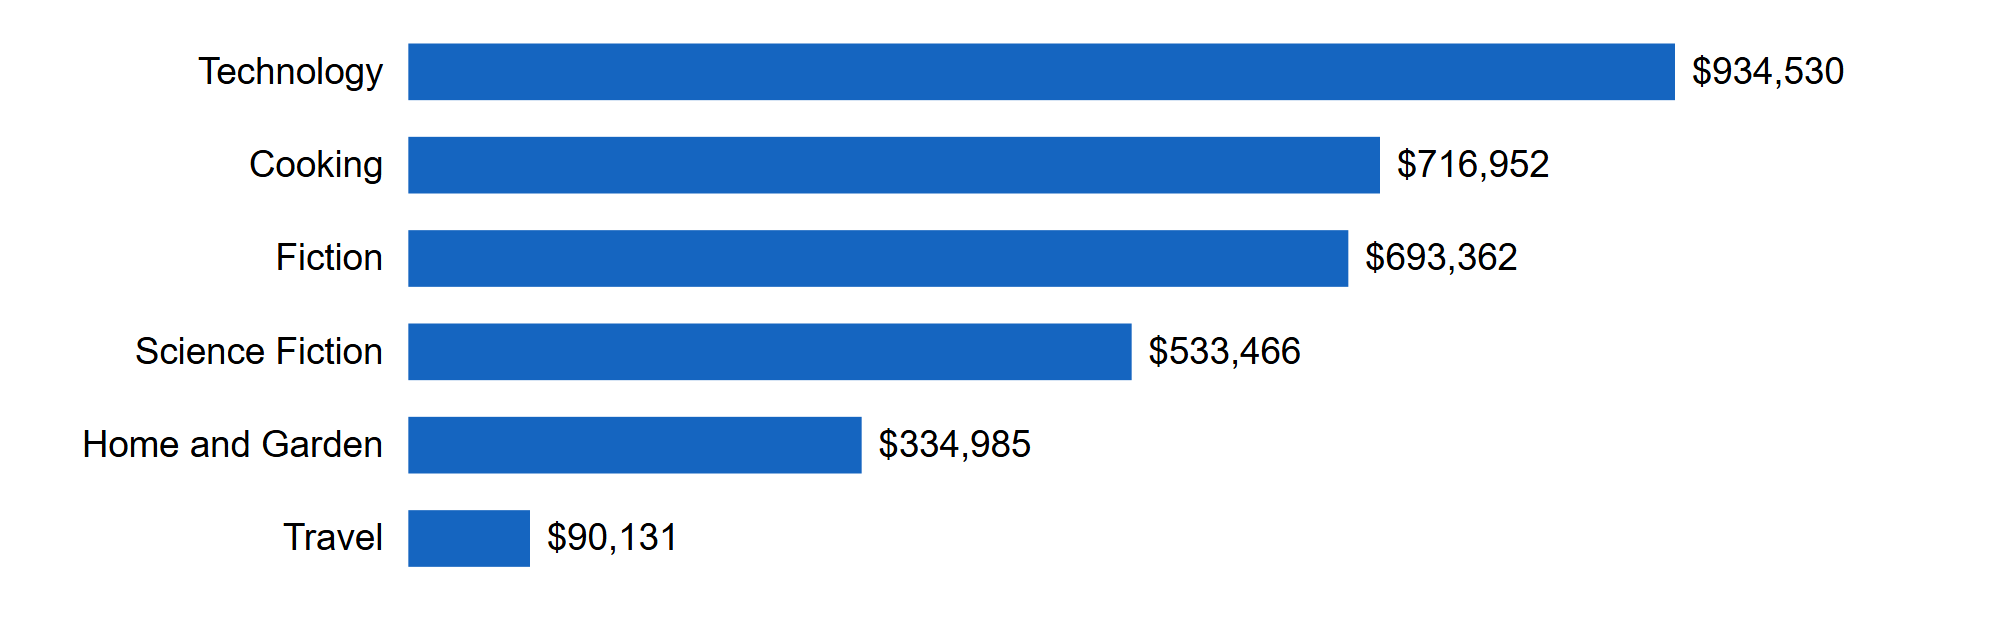
SVG is XML, so a pipeline can write diffable, sharp charts with its data tools. This script queries the joined tables and writes one g per bar:
import duckdb
from xml.sax.saxutils import escape
ch3 = "/mnt/d/Books/Data Engineering/demos/ch03/out/orders.parquet"
rows = duckdb.sql(f"""
    SELECT c.subject, sum(o.i.qty * o.i.unit_price) AS gross
    FROM (SELECT status, unnest(items) AS i FROM '{ch3}') o
    JOIN 'catalog.parquet' c ON c.book_id = o.i.book_id
    WHERE o.status <> 'cancelled' GROUP BY ALL ORDER BY gross DESC""").fetchall()
top = rows[0][1]
bars = []
for n, (subject, gross) in enumerate(rows):            # one <g> per bar: label, bar, value
    y, w = 20 + n * 56, 760 * float(gross / top)
    bars.append(f'<g transform="translate(0,{y})"><text x="230" y="30" text-anchor="end">'
                f'{escape(subject)}</text><rect x="245" y="6" width="{w:.0f}" height="34" '
                f'fill="#1565c0"/><text x="{255 + w:.0f}" y="30">${gross:,.0f}</text></g>')
svg = (f'<svg xmlns="http://www.w3.org/2000/svg" viewBox="0 0 1200 {40 + 56 * len(rows)}" '
       'font-family="Arial, Helvetica, sans-serif" font-size="22">\n'
       + "\n".join(bars) + "\n</svg>")
open("chart.svg", "w").write(svg)
print(len(rows), "bars,", len(svg), "bytes of SVG")
It printed 6 bars, 1259 bytes of SVG; the file, unchanged:
Escape text (xml.sax.saxutils.escape, or build with lxml 3,063 ), or the first & in a title breaks the chart. Generated SVG suits reports and static pages; dashboards want a charting library.