Workers with the same group.id add capacity, but parallelism comes from tasks: at most one per partition for a sink, one per table for a JDBC source. A second worker triggers a rebalance:
# Add a second worker with the same group.id and see where the connectors and tasks run
docker compose -f compose/connect.yaml --profile scale up -d --wait connect-2 2>/dev/null
sleep 10
curl -s 'localhost:33083/connectors?expand=status' | jq -r '.[].status | "\(.name): connector on " +
  "\(.connector.worker_id), tasks on \([.tasks[].worker_id] | join(" "))" | gsub(":8083"; "")'
Output
booknest-catalog: connector on l3-connect-2, tasks on l3-connect-2
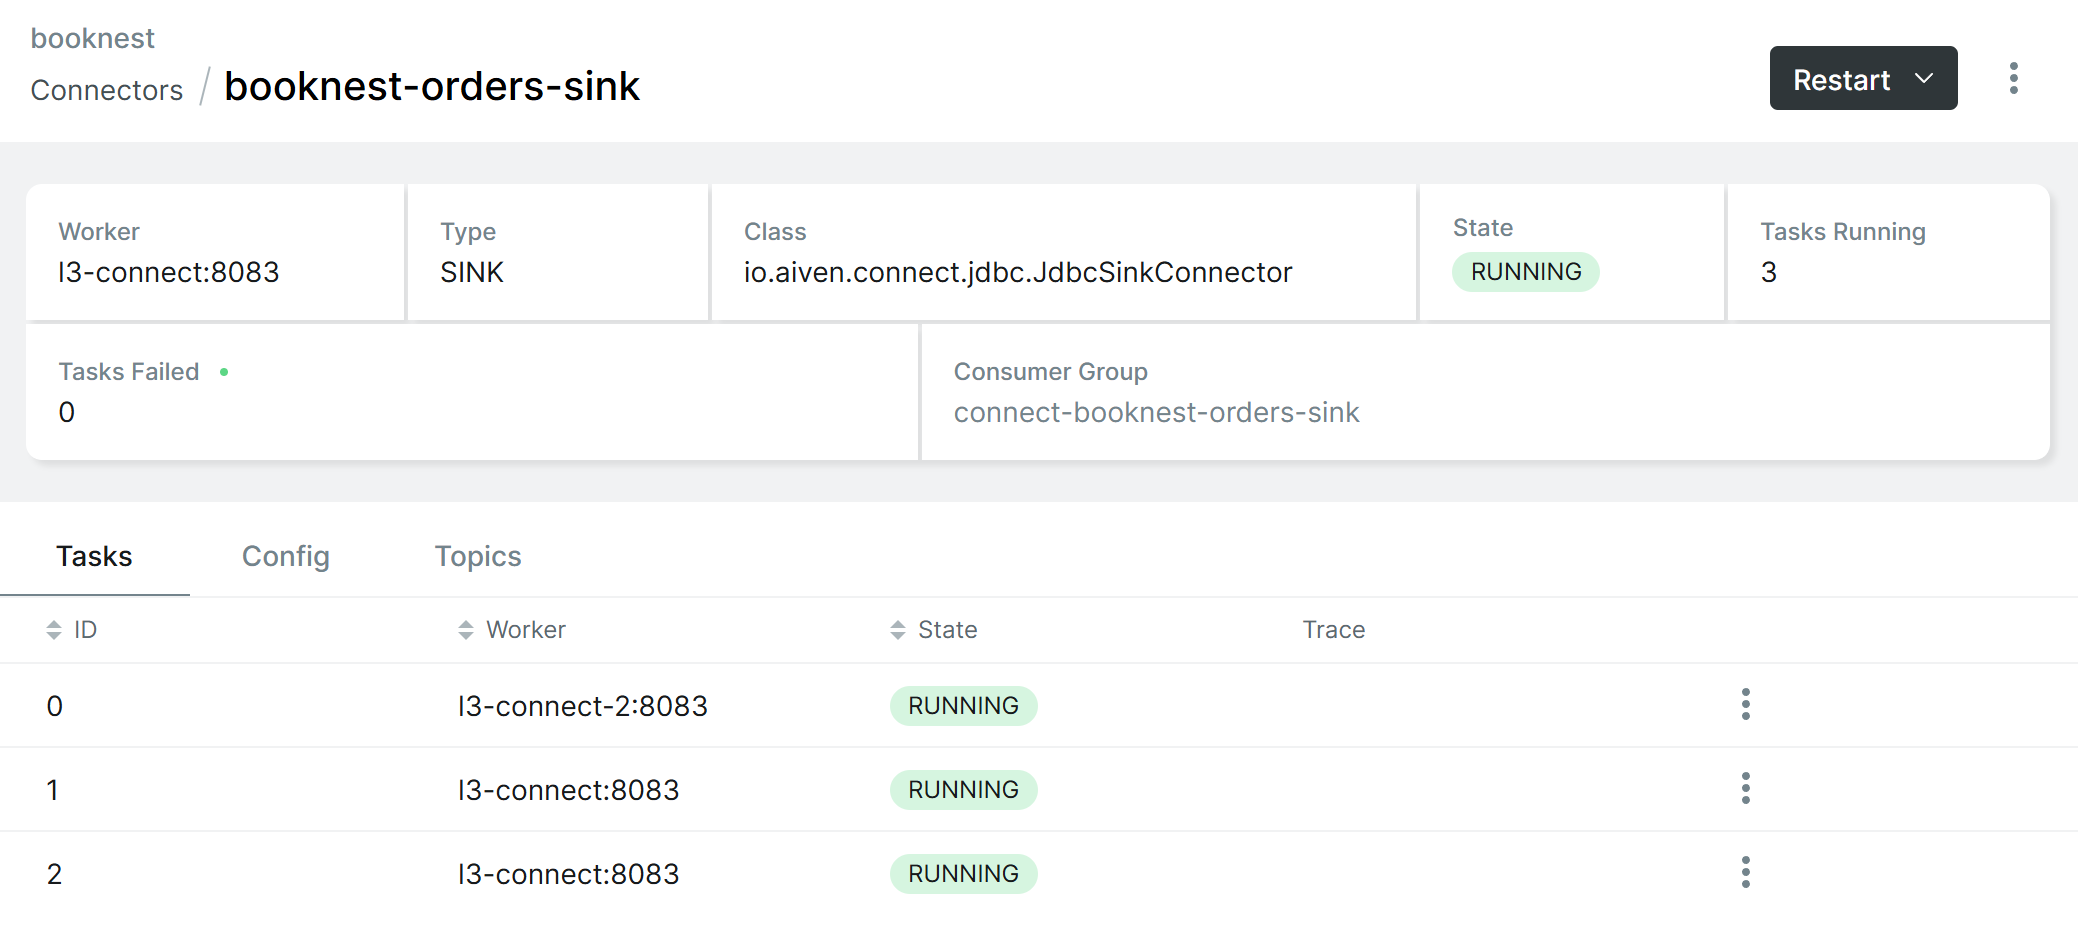
booknest-orders-sink: connector on l3-connect, tasks on l3-connect-2 l3-connect l3-connect
Some work moved to l3-connect-2; the rest kept running. kafbat UI shows the same REST data:
Sink progress is the consumer lag of connect-booknest-orders-sink (kafka-consumer-groups). Of the JMX metrics (Monitoring and Kafka UIs), alert on connector-failed-task-count, sink-record-lag-max, total-records-skipped and a zero source-record-poll-rate. A FAILED task never restarts itself: fix the cause, then POST .../restart?includeTasks=true&onlyFailed=true.