compose/flink.yaml runs a session cluster: l3-flink-jm (JobManager, web UI on port 33181) and one TaskManager with two slots, on the flink:2.3.0-java21 image.
# Start Flink, run the SQL file, then check what landed in booknest.daily-revenue
docker compose -f compose/flink.yaml up -d 2>/dev/null
until curl -sf localhost:33181/overview | grep -q '"taskmanagers":1'; do sleep 2; done
docker exec l3-flink-jm ./bin/sql-client.sh -f /sql/booknest.sql 2>&1 |
  grep -o 'Complete execution[a-zA-Z ]*\|ERROR.*'
docker exec l3-kafka /opt/kafka/bin/kafka-console-consumer.sh --bootstrap-server l3-kafka:9092 \
  --topic booknest.daily-revenue --from-beginning --timeout-ms 10000 2>/dev/null > daily.jsonl
head -2 daily.jsonl
jq -s -c '{rows: length, days: (map(.day_start) | unique | length),
           revenue: (map(.revenue) | add * 100 | round / 100)}' daily.jsonl
Output
Complete execution of the SQL update statement
{"day_start":"2025-01-01 00:00:00","channel":"ios","lines":103,"revenue":2673.08}
{"day_start":"2025-01-01 00:00:00","channel":"web","lines":48,"revenue":1433.46}
{"rows":1638,"days":546,"revenue":3303427.3}
The job wrote 1,638 rows, one per channel for each of 546 days, and they add up to 3,303,427.30, the total of A BookNest Streams Application. No line was dropped as late: the watermark advanced with the slowest partition. The web UI shows how the planner split the aggregation around the hash exchange:
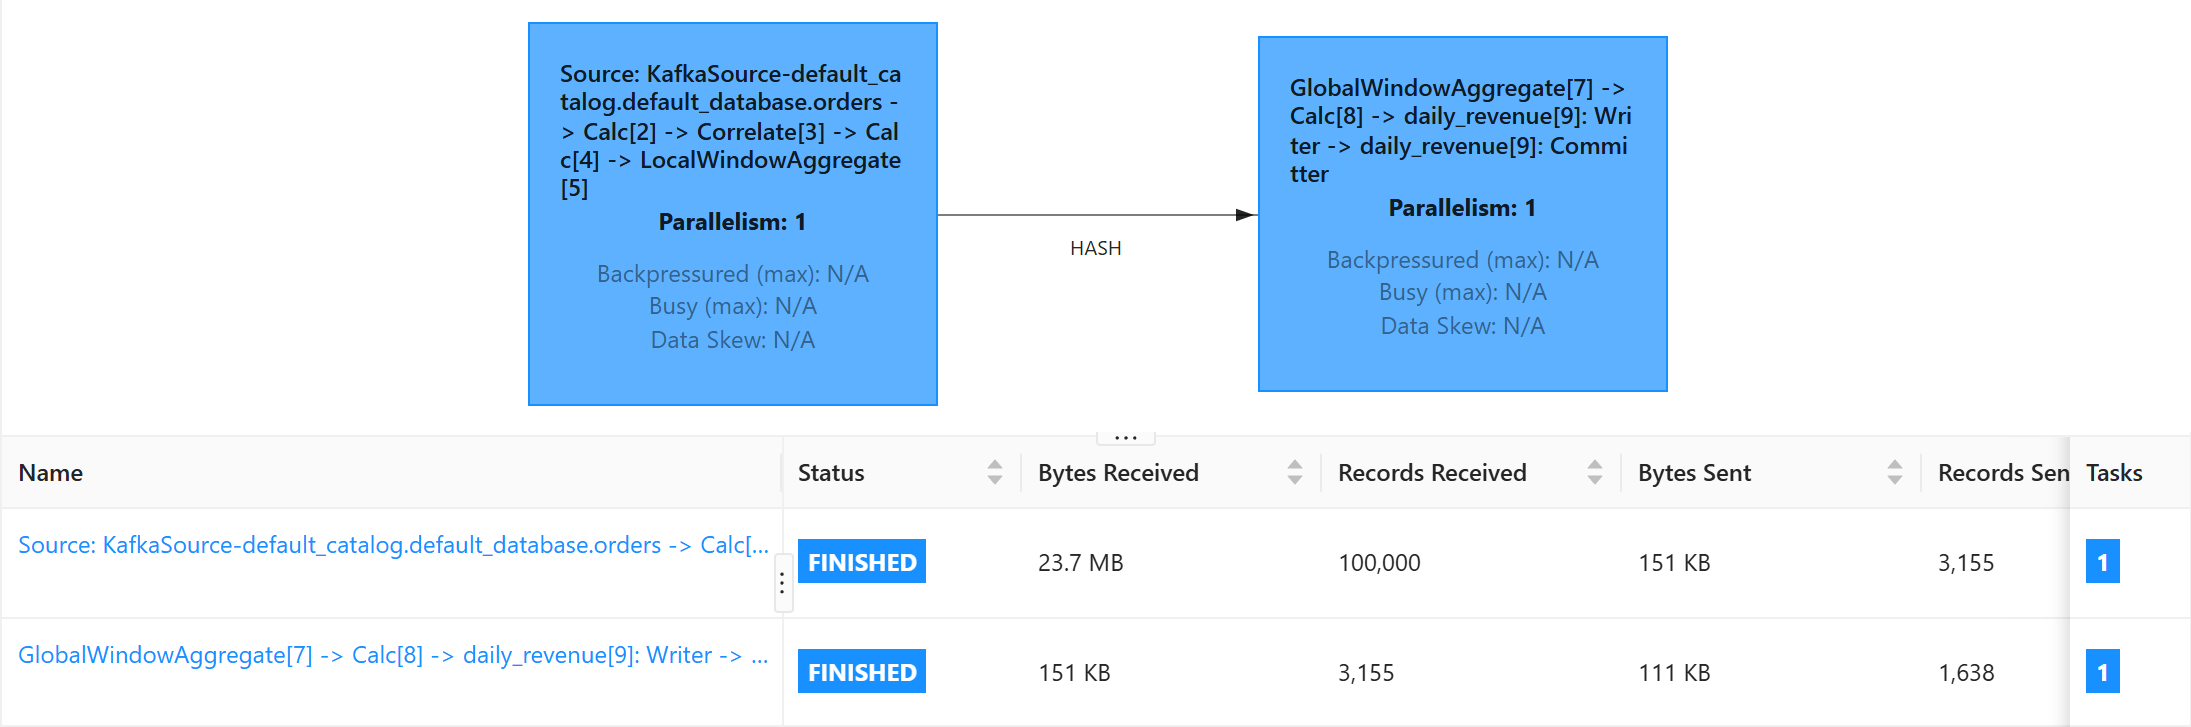
The local pre-aggregation before the exchange shrank 100,000 orders to 3,155 partial rows, so little data crossed the network; the whole job took about 3.5 seconds.