All three ran one at a time on one shared machine (four logical CPUs, 32 GB, WSL2 6 ) beside a Jenkins 8,793 controller and agent, at load averages of 1.5 to 2.9, so compare ratios rather than absolutes. Memory and CPU average three docker stats --no-stream samples 10 s apart, a minute after nginx 75 was ready; images were cached.
| Measure | kind 0.33.0 14,561 | k3d 5.9.0, k3s 1.37.0 51,195 | minikube 1.39.0 14,561 |
|---|---|---|---|
| Node image on disk | 1.34 GB | 378 MB (+141 MB helpers) | 1.89 GB |
| Cluster creation, two runs | 38 to 40 s | 32 to 36 s | 86 to 100 s |
| Memory, all containers | 708 MiB | 1,053 MiB | 652 MiB |
| Memory relative to kind | 1.00 | 1.49 | 0.92 |
| CPU at rest (share of one core) | 19% | 17% | 26% |
| System Pods | 11 | 9 (3 finished Jobs) | 10 |
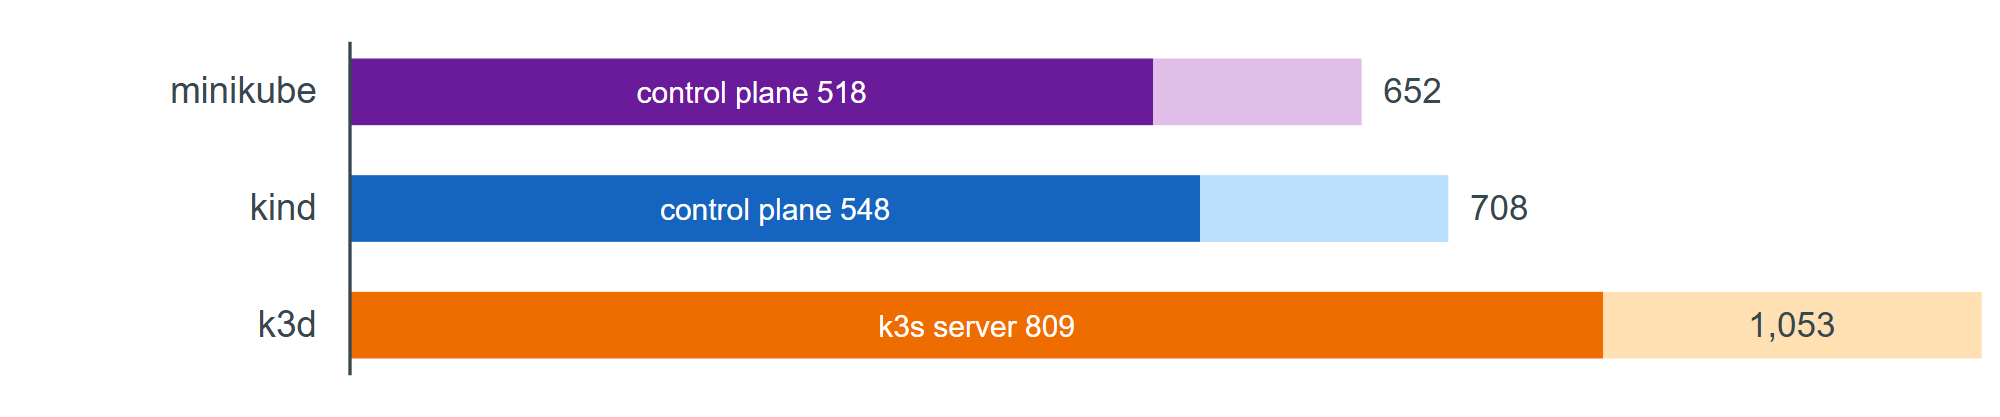
The darker part of each bar is the control-plane node; the lighter part is the worker (for k3d, the agent plus its 23 MiB load-balancer container). k3d used half as much memory again as kind, mostly in the k3s server with Traefik 27,315 and metrics-server 6,745 (--k3s-arg '--disable=traefik@server:*' narrows the gap). minikube was lightest at rest but slowest to create. First runs are dominated by downloads, and nginx readiness (29 to 65 s) by Docker Hub 514 . Any of the three fits a four-CPU host; run only one at a time.