Prometheus 16,091 (Apache-2.0) scrapes metrics endpoints, stores time series and answers PromQL; Grafana 2,264 (AGPL-3.0) draws dashboards. The kube-prometheus-stack 6,197 chart (91.5.2, github.com/prometheus-community/helm-charts (https://github.com/prometheus-community/helm-charts 6,197 )) installs both through the Prometheus Operator, with kube-state-metrics, recording rules and dashboards. Trim it:
alertmanager: { enabled: false }
nodeExporter: { enabled: false }
kubeEtcd: { enabled: false }               # kind binds these to 127.0.0.1
kubeControllerManager: { enabled: false }
kubeScheduler: { enabled: false }
kubeProxy: { enabled: false }
prometheus:
  prometheusSpec:
    retention: 6h
    resources: { requests: { cpu: 100m, memory: 400Mi }, limits: { memory: 1Gi } }
grafana:
  adminPassword: booknest-demo             # lab only
grafana.ini: { auth.anonymous: { enabled: true, org_role: Viewer } }helm repo add prometheus-community \
https://prometheus-community.github.io/helm-charts >/dev/null
helm install monitoring prometheus-community/kube-prometheus-stack --version 91.5.2 \
-n monitoring --create-namespace -f k8s/monitoring-values.yaml --wait --timeout 10m \
| grep STATUS
(kubectl -n monitoring port-forward svc/monitoring-grafana 33300:80 >/dev/null 2>&1 &)
(kubectl -n monitoring port-forward svc/monitoring-kube-prometheus-prometheus 33909:9090 \
>/dev/null 2>&1 &)
sleep 90
Q='sum by (pod) (rate(container_cpu_usage_seconds_total'
Q+='{namespace="booknest",container!=""}[2m]))'
curl -s localhost:33909/api/v1/query --data-urlencode "query=$Q" \
| jq -r '.data.result[] | "\(.metric.pod) \(.value[1] | tonumber * 1000 | floor)m"'STATUS: deployed api-b4bc995c9-tmrl6 100m ... load2 145m ... postgres-0 106m
ServiceMonitor objects told Prometheus what to scrape. Twelve minutes later, Grafana's "Namespace (Pods)" dashboard showed the Pods using 129% of the CPU they request, below the quota's one CPU (dashed): requests that low mislead the scheduler.
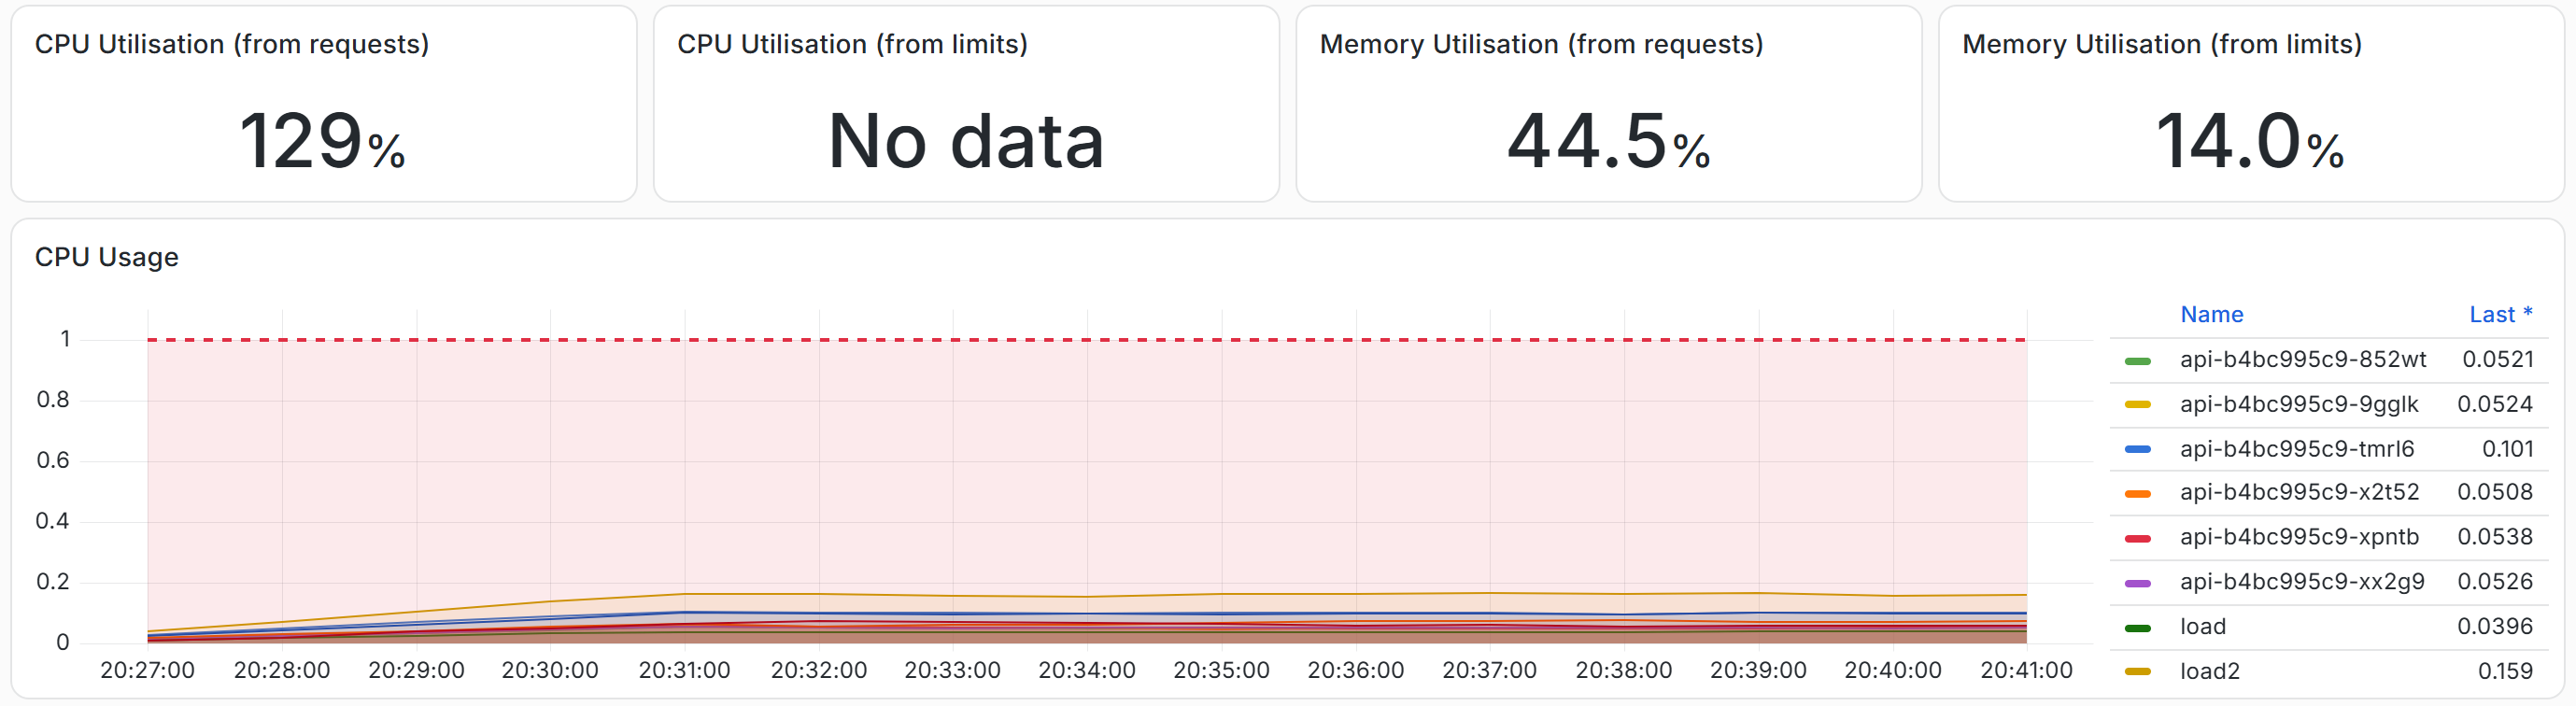
At 0.28 CPU and 609 MiB freshly installed, the stack was removed after the screenshot; helm 29,435 uninstall leaves the *.monitoring.coreos.com CRDs behind.