Put the pieces together and follow one command, kubectl 5,150 run web, which creates a single Pod from BookNest's Nginx 75 front-end image:
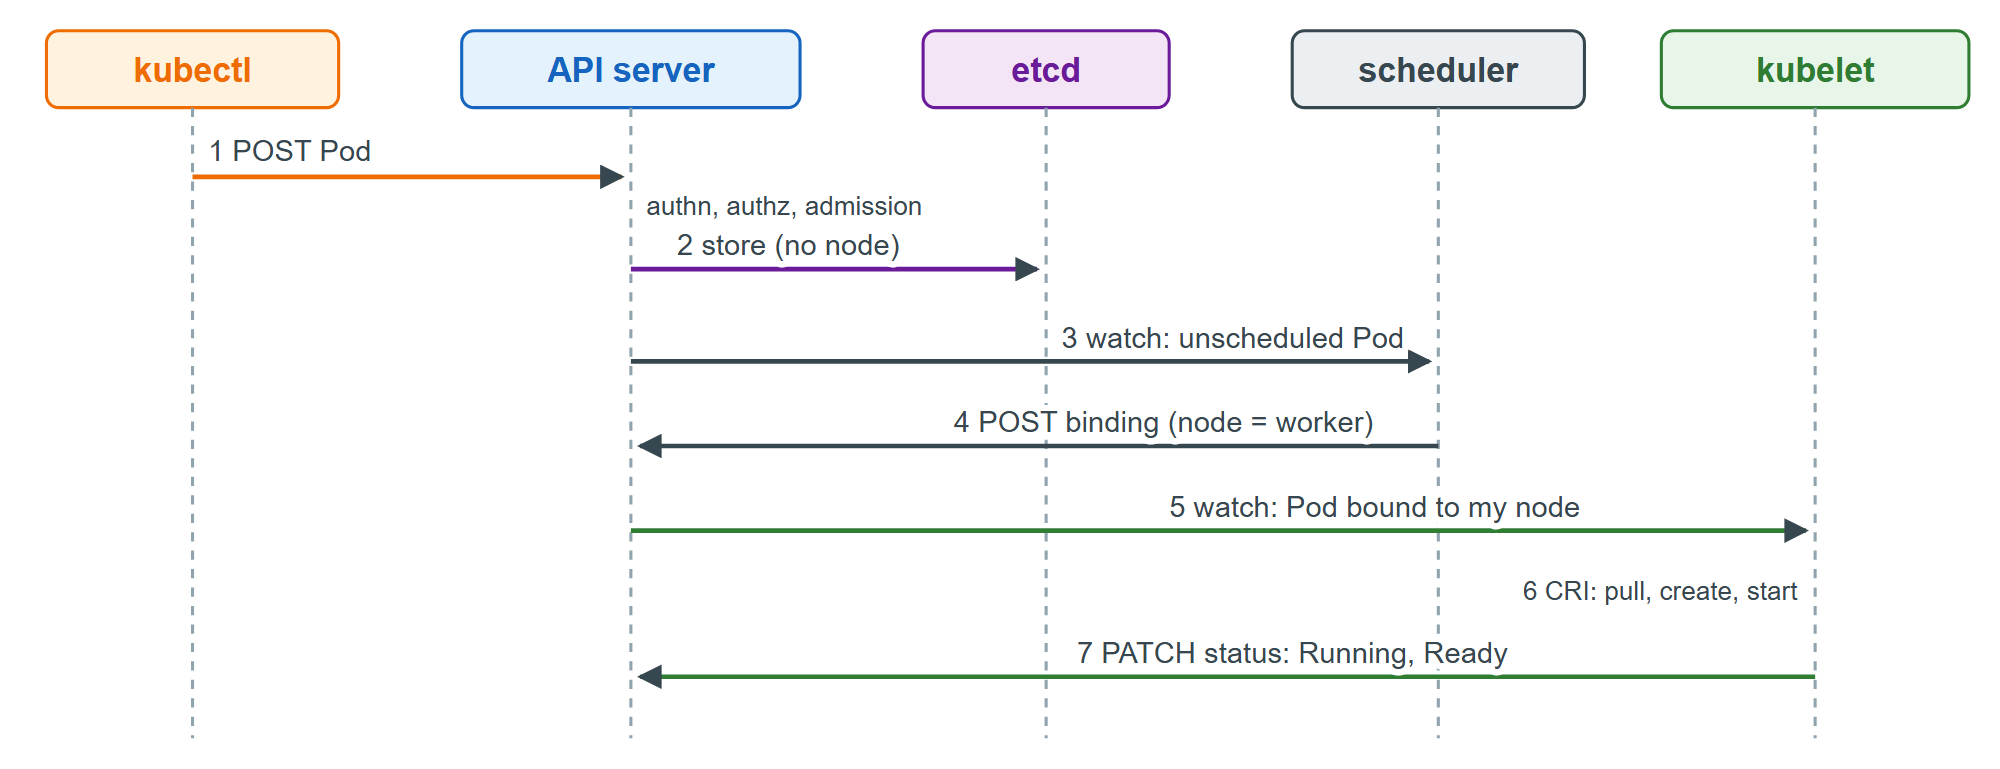
The Pod's events record the same steps, each tagged with the component that performed it:
kubectl run web --image=localhost:33500/booknest-web:1.3 --port=80
kubectl wait --for=condition=Ready pod/web --timeout=90s
kubectl get events --field-selector involvedObject.name=web --sort-by=.metadata.creationTimestamp \
  -o custom-columns=SOURCE:.source.component,REASON:.reason,MESSAGE:.message | cut -c1-95
Output
pod/web created
pod/web condition met
SOURCE              REASON      MESSAGE
default-scheduler   Scheduled   Successfully assigned default/web to l3-booknest-worker
kubelet             Pulling     Pulling image "localhost:33500/booknest-web:1.3"
kubelet             Pulled      Successfully pulled image "localhost:33500/booknest-web:1.3" in
kubelet             Created     Container created
kubelet             Started     Container started
Nobody told the scheduler or the kubelet to act: kubectl run only wrote an object, and two watchers reacted. For a stuck Pod, no Scheduled event means a scheduling problem; Scheduled followed by a failed pull or crash means a node problem (How Nodes Run Containers).