Each mean comes from star counts through d3.sum's accessor, which receives the index (one star at index 0). Sorting the rows before building the band scale sorts the bars, since the domain order is the drawing order:
<script src="https://cdn.jsdelivr.net/npm/d3@7.9.0/dist/d3.min.js"></script>
<script src="booknest-sales.js"></script><script src="booknest-prep.js"></script>
<svg id="ratings" width="560" height="130" font-family="Arial" font-size="11"></svg>
<script>
function ratingsChart(svg, { ratings }) {
  const W = +svg.attr('width'), H = +svg.attr('height');
  const rows = ratings.map(r => ({ book: r.book, key: r.book.key, n: d3.sum(r.counts),
    mean: d3.sum(r.counts, (c, i) => c * (i + 1)) / d3.sum(r.counts) }))
    .sort((a, b) => d3.descending(a.mean, b.mean));              // best first
  const y = d3.scaleBand(rows.map(r => r.key), [0, H - 20]).padding(0.2);
  const x = d3.scaleLinear([0, 5], [150, W - 70]);
  svg.append('g').attr('transform', `translate(0,${H - 20})`).call(d3.axisBottom(x).ticks(5));
  const bars = svg.append('g').selectAll('g').data(rows).join('g')
    .attr('data-keys', r => r.key).attr('transform', r => `translate(0,${y(r.key)})`);
  bars.append('rect').attr('x', x(0)).attr('height', y.bandwidth())
    .attr('width', r => x(r.mean) - x(0)).attr('fill', r => r.book.color);
  bars.append('text').attr('x', x(0) - 5).attr('y', y.bandwidth() / 2).attr('dy', '0.35em')
    .attr('text-anchor', 'end').text(r => r.book.title);
  bars.append('text').attr('x', r => x(r.mean) + 5).attr('y', y.bandwidth() / 2)
    .attr('dy', '0.35em').text(r => `${r.mean.toFixed(2)} (${r.n})`);
}
ratingsChart(d3.select('#ratings'), prepareSales(SALES));
</script>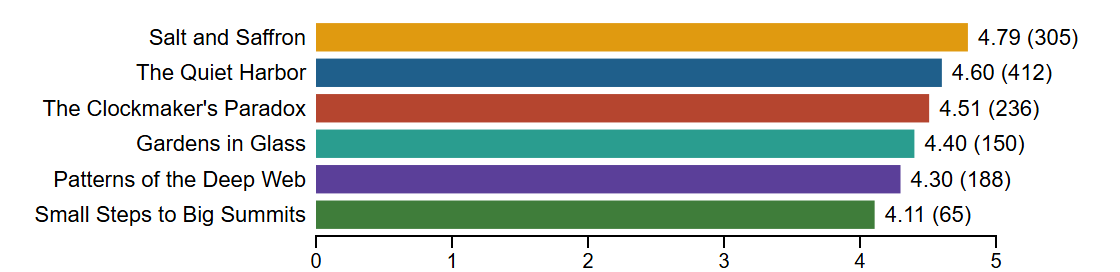
Small Steps to Big Summits trails at 4.11 from only 65 reviews: print the count, because a young book's mean moves with every review. The axis starts at zero, as a bar's length must. To re-sort on demand, change the band domain and transition each bar's transform (Animated Joins).
<!doctype html>
<style>
  body { margin: 0; padding: 8px; background: #fafaf7; font: 11px system-ui, sans-serif; color: #263238; }
  svg { max-width: 100%; height: auto; display: block; }
</style>
<script src="https://cdn.jsdelivr.net/npm/d3@7.9.0/dist/d3.min.js"></script>
<p>Sort by <button data-s="mean">mean rating</button> <button data-s="n">review count</button> <button data-s="title">title</button></p>
<svg id="ratings" width="560" height="150" font-size="11"></svg>
<script>
  // BookNest sample data, invented for these examples (not real sales)
  const SALES = (() => {
    const books = [
      { id: 1, key: 'harbor', title: 'The Quiet Harbor', author: 'Elena Marsh', genre: 'Fiction', color: '#1f5f8b', price: 18.99, rating: 4.6 },
      { id: 2, key: 'deepweb', title: 'Patterns of the Deep Web', author: 'Ravi Menon', genre: 'Technology', color: '#5b3f99', price: 39.5, rating: 4.3 },
      { id: 3, key: 'saffron', title: 'Salt and Saffron', author: 'Leila Haddad', genre: 'Cooking', color: '#e09a10', price: 24, rating: 4.8 },
      { id: 4, key: 'summit', title: 'Small Steps to Big Summits', author: 'Tom Okafor', genre: 'Self-Help', color: '#3f7d3a', price: 14.99, rating: 4.1 },
      { id: 5, key: 'clock', title: "The Clockmaker's Paradox", author: 'Iris Vale', genre: 'Science Fiction', color: '#b5452f', price: 16.2, rating: 4.5 },
      { id: 6, key: 'glass', title: 'Gardens in Glass', author: 'June Park', genre: 'Gardening', color: '#2a9d8f', price: 22.5, rating: 4.4 },
    ];
    const units = {        // units sold per month, January 2025 to August 2026
      1: [40, 47, 46, 47, 57, 51, 46, 54, 60, 60, 71, 111, 52, 42, 49, 56, 59, 48, 53, 51],
      2: [40, 37, 35, 41, 48, 43, 40, 42, 50, 53, 53, 84, 42, 35, 38, 41, 45, 41, 46, 46],
      3: [46, 45, 41, 46, 53, 49, 46, 45, 60, 51, 63, 100, 48, 48, 49, 48, 53, 49, 48, 52],
      4: [100, 80, 72, 70, 66, 66],                    // released March 2026
      5: [48, 47, 54, 52, 65, 55, 57, 58, 64, 66, 75, 124, 58, 49, 59, 56, 63, 57, 54, 57],
      6: [31, 30, 28, 35, 31, 32, 29, 30, 41, 36, 45, 64, 31, 30, 30, 38, 40, 38, 36, 38],
    };
    const months = d3.utcMonths(new Date('2025-01-01'), new Date('2026-09-01')).map(d3.utcFormat('%Y-%m'));
    const sales = books.flatMap(b => units[b.id].map((n, i) =>
      ({ month: months[i + months.length - units[b.id].length], book: b.id, units: n })));
    const ratings = [[4, 8, 20, 87, 293], [6, 10, 22, 95, 147], [2, 3, 8, 45, 342], [2, 3, 8, 24, 28],
      [4, 8, 20, 90, 228], [4, 7, 20, 82, 147]].map((counts, i) => ({ book: i + 1, counts }));  // 1 to 5 stars
    const regions = [{ id: '826', name: 'United Kingdom', units: 1480 }, { id: '276', name: 'Germany', units: 1120 },
      { id: '250', name: 'France', units: 760 }, { id: '372', name: 'Ireland', units: 540 },
      { id: '528', name: 'Netherlands', units: 410 }, { id: '724', name: 'Spain', units: 320 }];
    const links = [[5, 1, 38], [1, 3, 24], [2, 5, 18], [3, 6, 21], [4, 1, 12], [2, 6, 9], [4, 3, 15], [5, 6, 14]]
      .map(([source, target, value]) => ({ source, target, value }));   // customers who bought both
    return { books, sales, ratings, regions, links };
  })();
  // prepareSales(raw): parsed dates, sales linked to book objects, revenue and totals
  function prepareSales(raw) {
    const parse = d3.utcParse('%Y-%m'), books = raw.books.map(b => ({ ...b }));
    const byId = d3.index(books, b => b.id);
    const sales = raw.sales.map(s => ({ date: parse(s.month), book: byId.get(s.book),
      units: s.units, revenue: s.units * byId.get(s.book).price }));
    for (const [book, rows] of d3.group(sales, s => s.book)) {
      book.units = d3.sum(rows, s => s.units);
      book.revenue = d3.sum(rows, s => s.revenue);
    }
    const months = d3.rollups(sales, v => ({ units: d3.sum(v, s => s.units),
      revenue: d3.sum(v, s => s.revenue) }), s => +s.date).map(([t, v]) => ({ date: new Date(t), ...v }))
      .sort((a, b) => a.date - b.date);
    const ratings = raw.ratings.map(r => ({ ...r, book: byId.get(r.book) }));
    return { ...raw, books, sales, months, ratings };
  }

  function ratingsChart(svg, { ratings }) {
    const W = +svg.attr('width'), H = +svg.attr('height');
    // d3.sum's accessor receives the index: one star at index 0
    const rows = ratings.map(r => ({ book: r.book, key: r.book.key, n: d3.sum(r.counts),
      mean: d3.sum(r.counts, (c, i) => c * (i + 1)) / d3.sum(r.counts) }));
    const y = d3.scaleBand().range([0, H - 20]).padding(0.2);
    const x = d3.scaleLinear([0, 5], [150, W - 70]);                  // bars start at zero
    svg.append('g').attr('transform', `translate(0,${H - 20})`).call(d3.axisBottom(x).ticks(5));
    const bars = svg.append('g').selectAll('g').data(rows).join('g').attr('data-keys', r => r.key);
    bars.append('rect').attr('x', x(0)).attr('width', r => x(r.mean) - x(0)).attr('fill', r => r.book.color);
    bars.append('text').attr('class', 't').attr('x', x(0) - 5).attr('dy', '0.35em').attr('text-anchor', 'end').text(r => r.book.title);
    bars.append('text').attr('class', 'v').attr('x', r => x(r.mean) + 5).attr('dy', '0.35em')
      .text(r => `${r.mean.toFixed(2)} (${r.n})`);            // print the count: small samples move
    return function sort(by, ms = 600) {
      const order = { mean: (a, b) => b.mean - a.mean, n: (a, b) => b.n - a.n,
        title: (a, b) => d3.ascending(a.book.title, b.book.title) }[by];
      y.domain(d3.sort(rows, order).map(r => r.key));            // the domain order is the drawing order
      bars.transition().duration(ms).attr('transform', r => `translate(0,${y(r.key)})`);
      bars.select('rect').attr('height', y.bandwidth());
      bars.selectAll('text').attr('y', y.bandwidth() / 2);
    };
  }
  const sort = ratingsChart(d3.select('#ratings'), prepareSales(SALES));
  d3.selectAll('button').on('click', e => sort(e.target.dataset.s));
  sort('mean', 0);
</script>