Production charts put a canvas for the many marks under an SVG for axes and the highlighted mark. d3.quadtree finds the nearest of 50,000 points almost instantly; a dispatched pointermove sets the frame:
<script src="https://cdn.jsdelivr.net/npm/d3@7.9.0/dist/d3.min.js"></script>
<script src="booknest-orders.js"></script>
<div style="position:relative;font:11px Arial">
  <canvas width="620" height="180" style="position:absolute"></canvas>
  <svg width="620" height="180" style="position:relative"></svg>
</div>
<script>
  const points = orders(50000), svg = d3.select('svg');
  const x = d3.scaleLinear([0, 24], [40, 610]), y = d3.scaleLog([5, 200], [155, 5]);
  const ctx = document.querySelector('canvas').getContext('2d');
  ctx.fillStyle = 'rgba(31, 95, 139, 0.3)';
  for (const p of points) ctx.fillRect(x(p.hour) - 1, y(p.value) - 1, 2, 2);
  svg.append('g').attr('transform', 'translate(0,156)').call(d3.axisBottom(x).ticks(12));
  svg.append('g').attr('transform', 'translate(40,0)').call(d3.axisLeft(y).ticks(4, '$,.0f'));
  const tree = d3.quadtree(points, p => x(p.hour), p => y(p.value));    // pixel coordinates
  const mark = svg.append('circle').attr('r', 6).attr('fill', 'none').attr('stroke', 'red');
  const label = svg.append('text').attr('fill', '#b5452f');
  svg.on('pointermove', event => {
    const p = tree.find(...d3.pointer(event), 20);                 // undefined beyond 20 px
    mark.attr('display', p ? null : 'none')
      .attr('cx', p && x(p.hour)).attr('cy', p && y(p.value));
    label.text(p ? `${Math.floor(p.hour)}:00, $${p.value.toFixed(2)}` : '')
      .attr('x', p && x(p.hour) + 10).attr('y', p && y(p.value) - 8);
  });
  const box = svg.node().getBoundingClientRect();
  svg.node().dispatchEvent(new PointerEvent('pointermove', { clientX: box.x + 520,
    clientY: box.y + 40 }));
  window.__done = true;
</script>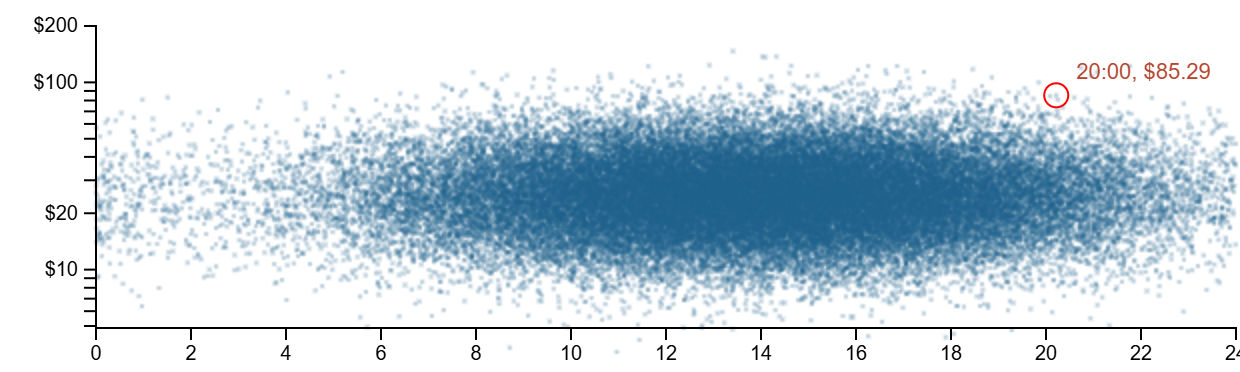
The canvas never redraws; the pointer moves two SVG elements, so interaction cost ignores the point count. To zoom, redraw the canvas from rescaled scales once per frame while d3-axis updates the SVG.
<!doctype html>
<style>
  body { margin: 0; padding: 8px; background: #fafaf7; font: 11px system-ui, sans-serif; color: #263238; }
  .stack { position: relative; width: 600px; height: 190px; max-width: 100%; }
  .stack canvas, .stack svg { position: absolute; left: 0; top: 0; }
</style>
<script src="https://cdn.jsdelivr.net/npm/d3@7.9.0/dist/d3.min.js"></script>
<div class="stack"><canvas width="600" height="190"></canvas><svg width="600" height="190"></svg></div>
<p id="out"></p>
<script>
  // 50,000 sample orders: hour of day (busier in the evening) and order value (log-normal)
  function orders(n) {
    const random = d3.randomLcg(42), hour = d3.randomNormal.source(random)(19, 4);
    const value = d3.randomLogNormal.source(random)(Math.log(28), 0.6);
    return Array.from({ length: n }, () => ({ hour: (hour() + 24) % 24, value: Math.min(199, Math.max(5, value())) }));
  }
  const t0 = performance.now(), points = orders(50000), svg = d3.select('svg');
  const x = d3.scaleLinear([0, 24], [40, 590]), y = d3.scaleLog([5, 200], [165, 5]);

  // The many marks: painted once on the canvas, never redrawn
  const ctx = document.querySelector('canvas').getContext('2d');
  ctx.fillStyle = 'rgba(31, 95, 139, 0.25)';
  for (const p of points) ctx.fillRect(x(p.hour) - 1, y(p.value) - 1, 2, 2);

  // The few: axes and the highlight live in the SVG on top
  svg.append('g').attr('transform', 'translate(0,166)').call(d3.axisBottom(x).ticks(12).tickFormat(h => `${h}:00`));
  svg.append('g').attr('transform', 'translate(40,0)').call(d3.axisLeft(y).ticks(4, '$,.0f'));
  const tree = d3.quadtree(points, p => x(p.hour), p => y(p.value));    // indexed in pixel coordinates
  const mark = svg.append('circle').attr('r', 6).attr('fill', 'none').attr('stroke', '#b5452f').attr('stroke-width', 2);
  const label = svg.append('text').attr('fill', '#b5452f').attr('font-weight', 'bold');
  function focus([mx, my]) {
    const p = tree.find(mx, my, 20);                                   // undefined beyond 20 px
    mark.attr('display', p ? null : 'none').attr('cx', p && x(p.hour)).attr('cy', p && y(p.value));
    label.text(p ? `${Math.floor(p.hour)}:${String(Math.floor(p.hour % 1 * 60)).padStart(2, '0')}, $${p.value.toFixed(2)}` : '')
      .attr('x', p && x(p.hour) + 10).attr('y', p && y(p.value) - 8);
  }
  svg.on('pointermove', event => focus(d3.pointer(event)));
  focus([470, 70]);
  d3.select('#out').text(`${points.length.toLocaleString()} points generated, painted and indexed in ` +
    `${(performance.now() - t0).toFixed(0)} ms; hovering moves just two SVG elements.`);
</script>