Charts should not call each other, or every new chart means editing the others. d3.dispatch('focus') is an event bus instead: a mark calls bus.call('focus', null, key, event), and listeners registered under their own names (focus.dim, focus.tip) react. The functions of Sales Trend Chart-A Genre Breakdown Donut Chart are saved as booknest-dashboard.js:
<script src="https://cdn.jsdelivr.net/npm/d3@7.9.0/dist/d3.min.js"></script>
<script src="booknest-sales.js"></script><script src="booknest-prep.js"></script>
<script src="booknest-dashboard.js"></script>
<style>
  #dash { display: grid; grid-template-columns: 400px 300px; gap: 6px 20px; position: relative;
    font: 11px Arial }
  #trend { grid-column: 1 / -1 }  .dim { opacity: 0.15 }
  #tip { position: absolute; background: #263238; color: #fff; padding: 4px 7px;
    pointer-events: none }
</style>
<div id="dash"><svg id="trend" width="720" height="170"></svg><div id="tip" hidden></div>
  <svg id="ratings" width="400" height="130"></svg><svg id="genre" width="300" height="130">
  </svg></div>
<script>
  const data = prepareSales(SALES), bus = d3.dispatch('focus');
  [[trendChart, '#trend'], [ratingsChart, '#ratings'], [genreDonut, '#genre']]
    .forEach(([chart, id]) => chart(d3.select(id), data));
  const byKey = d3.index(data.books, b => b.key), marks = d3.selectAll('[data-keys]');
  const money = d3.format('$,.0f'), hole = d3.select('#genre .center'), total = hole.text();
  bus.on('focus.dim', key => marks.classed('dim', function () {
    return key && !this.dataset.keys.split(' ').includes(key); }));
  bus.on('focus.center', key => hole.text(key ? money(byKey.get(key).revenue) : total));
  bus.on('focus.tip', (key, event) => {
    const b = byKey.get(key), [px, py] = d3.pointer(event, d3.select('#dash').node());
    d3.select('#tip').property('hidden', !b).style('left', `${px + 12}px`)
      .style('top', `${py + 12}px`).html(b ? `<b>${b.title}</b><br>${b.units} units` : '');
  });
  marks.on('pointerenter', function (event) {
    bus.call('focus', null, this.dataset.keys.split(' ')[0], event);
  }).on('pointerleave', event => bus.call('focus', null, null, event));
  const el = d3.select('#ratings [data-keys=saffron]').node(), r = el.getBoundingClientRect();
  el.dispatchEvent(new PointerEvent('pointerenter', { clientX: r.x + 210, clientY: r.y + 8 }));
  window.__done = true;
</script>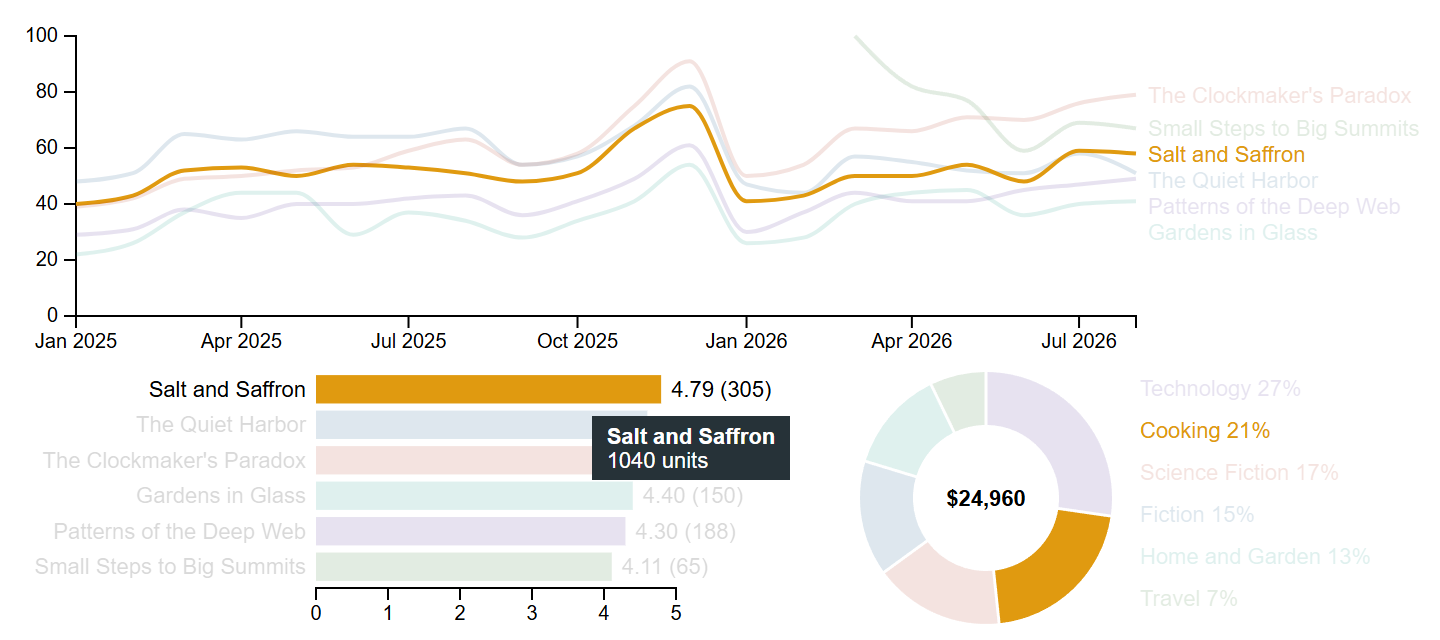
A script sets the frame: one pointerenter on the Salt and Saffron bar. focus.dim fades every mark whose data-keys lack saffron, focus.center swaps the donut's total for the book's $24,960, and focus.tip places an HTML tooltip (easier to style than SVG <text>; pointer-events: none stops it stealing the hover). Thin lines are hard to hover: give them an invisible wide stroke, or use Delaunay.find() (d3-delaunay).
<!doctype html>
<style>
  body { margin: 0; padding: 8px; background: #fafaf7; color: #263238; }
  #dash { display: grid; grid-template-columns: 330px 250px; gap: 6px 14px; position: relative; font: 10px system-ui, sans-serif; }
  #trend { grid-column: 1 / -1 }
  .dim { opacity: 0.15 }
  #tip { position: absolute; background: #263238; color: #fff; padding: 4px 7px; pointer-events: none; font-size: 11px; }
</style>
<script src="https://cdn.jsdelivr.net/npm/d3@7.9.0/dist/d3.min.js"></script>
<div id="dash"><svg id="trend" width="590" height="150"></svg><div id="tip" hidden></div>
  <svg id="ratings" width="330" height="120"></svg><svg id="genre" width="250" height="120"></svg></div>
<script>
  // BookNest sample data, invented for these examples (not real sales)
  const SALES = (() => {
    const books = [
      { id: 1, key: 'harbor', title: 'The Quiet Harbor', author: 'Elena Marsh', genre: 'Fiction', color: '#1f5f8b', price: 18.99, rating: 4.6 },
      { id: 2, key: 'deepweb', title: 'Patterns of the Deep Web', author: 'Ravi Menon', genre: 'Technology', color: '#5b3f99', price: 39.5, rating: 4.3 },
      { id: 3, key: 'saffron', title: 'Salt and Saffron', author: 'Leila Haddad', genre: 'Cooking', color: '#e09a10', price: 24, rating: 4.8 },
      { id: 4, key: 'summit', title: 'Small Steps to Big Summits', author: 'Tom Okafor', genre: 'Self-Help', color: '#3f7d3a', price: 14.99, rating: 4.1 },
      { id: 5, key: 'clock', title: "The Clockmaker's Paradox", author: 'Iris Vale', genre: 'Science Fiction', color: '#b5452f', price: 16.2, rating: 4.5 },
      { id: 6, key: 'glass', title: 'Gardens in Glass', author: 'June Park', genre: 'Gardening', color: '#2a9d8f', price: 22.5, rating: 4.4 },
    ];
    const units = {        // units sold per month, January 2025 to August 2026
      1: [40, 47, 46, 47, 57, 51, 46, 54, 60, 60, 71, 111, 52, 42, 49, 56, 59, 48, 53, 51],
      2: [40, 37, 35, 41, 48, 43, 40, 42, 50, 53, 53, 84, 42, 35, 38, 41, 45, 41, 46, 46],
      3: [46, 45, 41, 46, 53, 49, 46, 45, 60, 51, 63, 100, 48, 48, 49, 48, 53, 49, 48, 52],
      4: [100, 80, 72, 70, 66, 66],                    // released March 2026
      5: [48, 47, 54, 52, 65, 55, 57, 58, 64, 66, 75, 124, 58, 49, 59, 56, 63, 57, 54, 57],
      6: [31, 30, 28, 35, 31, 32, 29, 30, 41, 36, 45, 64, 31, 30, 30, 38, 40, 38, 36, 38],
    };
    const months = d3.utcMonths(new Date('2025-01-01'), new Date('2026-09-01')).map(d3.utcFormat('%Y-%m'));
    const sales = books.flatMap(b => units[b.id].map((n, i) =>
      ({ month: months[i + months.length - units[b.id].length], book: b.id, units: n })));
    const ratings = [[4, 8, 20, 87, 293], [6, 10, 22, 95, 147], [2, 3, 8, 45, 342], [2, 3, 8, 24, 28],
      [4, 8, 20, 90, 228], [4, 7, 20, 82, 147]].map((counts, i) => ({ book: i + 1, counts }));  // 1 to 5 stars
    const regions = [{ id: '826', name: 'United Kingdom', units: 1480 }, { id: '276', name: 'Germany', units: 1120 },
      { id: '250', name: 'France', units: 760 }, { id: '372', name: 'Ireland', units: 540 },
      { id: '528', name: 'Netherlands', units: 410 }, { id: '724', name: 'Spain', units: 320 }];
    const links = [[5, 1, 38], [1, 3, 24], [2, 5, 18], [3, 6, 21], [4, 1, 12], [2, 6, 9], [4, 3, 15], [5, 6, 14]]
      .map(([source, target, value]) => ({ source, target, value }));   // customers who bought both
    return { books, sales, ratings, regions, links };
  })();
  // prepareSales(raw): parsed dates, sales linked to book objects, revenue and totals
  function prepareSales(raw) {
    const parse = d3.utcParse('%Y-%m'), books = raw.books.map(b => ({ ...b }));
    const byId = d3.index(books, b => b.id);
    const sales = raw.sales.map(s => ({ date: parse(s.month), book: byId.get(s.book),
      units: s.units, revenue: s.units * byId.get(s.book).price }));
    for (const [book, rows] of d3.group(sales, s => s.book)) {
      book.units = d3.sum(rows, s => s.units);
      book.revenue = d3.sum(rows, s => s.revenue);
    }
    const months = d3.rollups(sales, v => ({ units: d3.sum(v, s => s.units),
      revenue: d3.sum(v, s => s.revenue) }), s => +s.date).map(([t, v]) => ({ date: new Date(t), ...v }))
      .sort((a, b) => a.date - b.date);
    const ratings = raw.ratings.map(r => ({ ...r, book: byId.get(r.book) }));
    return { ...raw, books, sales, months, ratings };
  }

  // The three chart functions, compacted; every mark carries data-keys for linking
  function trendChart(svg, { sales }) {
    const W = +svg.attr('width'), H = +svg.attr('height'), m = { t: 8, r: 140, b: 18, l: 28 };
    const x = d3.scaleUtc(d3.extent(sales, d => d.date), [m.l, W - m.r]);
    const y = d3.scaleLinear([0, 130], [H - m.b, m.t]);
    svg.append('g').attr('transform', `translate(0,${H - m.b})`).call(d3.axisBottom(x).ticks(6));
    svg.append('g').attr('transform', `translate(${m.l},0)`).call(d3.axisLeft(y).ticks(4));
    const series = d3.groups(sales, d => d.book);
    svg.append('g').attr('fill', 'none').attr('stroke-width', 2).selectAll('path').data(series).join('path')
      .attr('data-keys', ([b]) => b.key).attr('stroke', ([b]) => b.color)
      .attr('d', ([, rows]) => d3.line(d => x(d.date), d => y(d.units)).curve(d3.curveMonotoneX)(rows));
    svg.append('g').selectAll('text').data(series).join('text').attr('data-keys', ([b]) => b.key)
      .attr('x', W - m.r + 6).attr('y', (s, i) => m.t + 6 + i * 20).attr('fill', ([b]) => b.color).text(([b]) => b.title);
  }
  function ratingsChart(svg, { ratings }) {
    const rows = ratings.map(r => ({ book: r.book, mean: d3.sum(r.counts, (c, i) => c * (i + 1)) / d3.sum(r.counts) }))
      .sort((a, b) => b.mean - a.mean);
    const y = d3.scaleBand(rows.map(r => r.book.key), [0, 120]).padding(0.2), x = d3.scaleLinear([0, 5], [60, 300]);
    const g = svg.selectAll('g').data(rows).join('g').attr('data-keys', r => r.book.key)
      .attr('transform', r => `translate(0,${y(r.book.key)})`);
    g.append('rect').attr('x', x(0)).attr('width', r => x(r.mean) - x(0)).attr('height', y.bandwidth()).attr('fill', r => r.book.color);
    g.append('text').attr('x', 55).attr('y', y.bandwidth() / 2).attr('dy', '0.35em').attr('text-anchor', 'end').text(r => r.book.key);
    g.append('text').attr('x', r => x(r.mean) + 4).attr('y', y.bandwidth() / 2).attr('dy', '0.35em').text(r => r.mean.toFixed(2));
  }
  function genreDonut(svg, { books }) {
    const r = 58, arcs = d3.pie().value(b => b.revenue)(books);
    const g = svg.append('g').attr('transform', `translate(${r + 2},${r + 2})`);
    g.selectAll('path').data(arcs).join('path').attr('data-keys', a => a.data.key).attr('fill', a => a.data.color)
      .attr('d', d3.arc().innerRadius(r * 0.58).outerRadius(r).padAngle(0.02));
    g.append('text').attr('class', 'center').attr('text-anchor', 'middle').attr('dy', '0.35em').attr('font-weight', 'bold')
      .text(d3.format('$.3s')(d3.sum(books, b => b.revenue)));
    svg.append('g').selectAll('text').data(arcs).join('text').attr('data-keys', a => a.data.key)
      .attr('x', 2 * r + 12).attr('y', a => 14 + a.index * 18).attr('fill', a => a.data.color).text(a => a.data.genre);
  }

  const data = prepareSales(SALES), bus = d3.dispatch('focus');       // the event bus
  [[trendChart, '#trend'], [ratingsChart, '#ratings'], [genreDonut, '#genre']].forEach(([chart, id]) => chart(d3.select(id), data));
  const byKey = d3.index(data.books, b => b.key), marks = d3.selectAll('[data-keys]');
  const money = d3.format('$,.0f'), hole = d3.select('#genre .center'), total = hole.text();
  // Listeners register under their own names; charts never call each other
  bus.on('focus.dim', key => marks.classed('dim', function () { return key && !this.dataset.keys.split(' ').includes(key); }));
  bus.on('focus.center', key => hole.text(key ? money(byKey.get(key).revenue) : total));
  bus.on('focus.tip', (key, event) => {
    const b = byKey.get(key), [px, py] = d3.pointer(event, d3.select('#dash').node());
    d3.select('#tip').property('hidden', !b).style('left', `${px + 12}px`).style('top', `${py + 12}px`)
      .html(b ? `<b>${b.title}</b><br>${b.units} units, ${money(b.revenue)}` : '');
  });
  marks.on('pointerenter', function (event) { bus.call('focus', null, this.dataset.keys.split(' ')[0], event); })
    .on('pointerleave', event => bus.call('focus', null, null, event));
  // One simulated pointerenter on the Salt and Saffron bar
  const bar = d3.select('#ratings [data-keys="saffron"] rect').node(), box = bar.getBoundingClientRect();
  bar.parentNode.dispatchEvent(new PointerEvent('pointerenter', { clientX: box.x + box.width / 2, clientY: box.y + 4 }));
</script>