Without a key, data() pairs by position, so after a re-sort every element receives another book's datum and an animated update (Animated Joins) would morph one bar into another. A key function such as d => d.id matches old and new data by equal keys instead.
The chapter's data file, booknest-sales.json, repeats the six catalog books with their palette colors; the rest is sample data invented for this chapter, not real sales: sales (106 rows such as {"month": "2025-01", "book": 1, "units": 48}, none for Small Steps to Big Summits before its March 2026 release), ratings (star counts), regions (units in six countries) and links (books bought together). Pages opened from disk load booknest-sales.js, the same object as a global SALES:
<script src="https://cdn.jsdelivr.net/npm/d3@7.9.0/dist/d3.min.js"></script>
<script src="booknest-sales.js"></script>
<svg width="640" height="186" font-family="Arial" font-size="13"></svg>
<script>
  const books = SALES.books.map(b => ({ ...b,
    units: d3.sum(SALES.sales.filter(s => s.book === b.id), s => s.units) }));
  const draw = data => d3.select('svg').selectAll('g').data(data, d => d.id)   // keyed
    .join(enter => {
      const g = enter.append('g');
      g.append('rect').attr('height', 26).attr('fill', d => d.color);
      g.append('text').attr('x', 6).attr('y', 18).attr('fill', 'white').text(d => d.title);
      g.append('text').attr('class', 'n').attr('y', 18).text(d => d.units);
      return g;
    })
    .attr('transform', (d, i) => `translate(0, ${i * 31})`)
    .call(g => g.select('rect').attr('width', d => d.units / 2.4))
    .call(g => g.select('.n').attr('x', d => d.units / 2.4 + 6));
  const before = draw(books).nodes();
  const after = draw(d3.sort(books, d => -d.units)).nodes();    // best seller first
  console.log('elements reused:', after.every(n => before.includes(n)));
</script>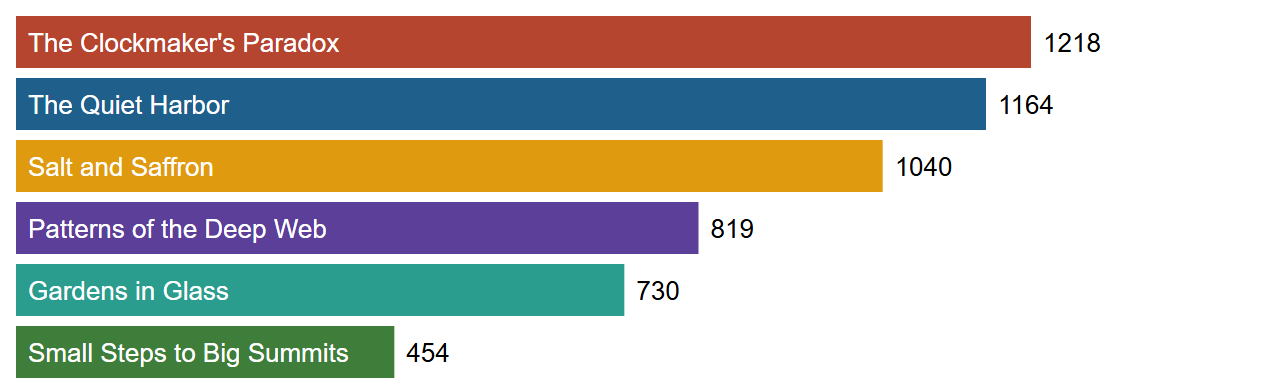
The keyed second draw moved the six existing groups rather than rewriting them (the page logs elements reused: true), and join() reordered them in the DOM to match. The bars are hand-scaled by 2.4; Scales and Axes brings scales and an axis.
<!doctype html>
<style>
  body { margin: 0; padding: 8px; background: #fafaf7; font: 13px system-ui, sans-serif; color: #263238; }
  svg { width: 100%; max-width: 600px; display: block; }
</style>
<script src="https://cdn.jsdelivr.net/npm/d3@7.9.0/dist/d3.min.js"></script>
<p><button id="units">Sort by units</button> <button id="title">Sort by title</button> <button id="catalog">Catalog order</button> <span id="out"></span></p>
<svg viewBox="0 0 600 186" font-size="13"></svg>
<script>
  // BookNest sample data, invented for these examples (not real sales)
  const SALES = (() => {
    const books = [
      { id: 1, key: 'harbor', title: 'The Quiet Harbor', author: 'Elena Marsh', genre: 'Fiction', color: '#1f5f8b', price: 18.99, rating: 4.6 },
      { id: 2, key: 'deepweb', title: 'Patterns of the Deep Web', author: 'Ravi Menon', genre: 'Technology', color: '#5b3f99', price: 39.5, rating: 4.3 },
      { id: 3, key: 'saffron', title: 'Salt and Saffron', author: 'Leila Haddad', genre: 'Cooking', color: '#e09a10', price: 24, rating: 4.8 },
      { id: 4, key: 'summit', title: 'Small Steps to Big Summits', author: 'Tom Okafor', genre: 'Self-Help', color: '#3f7d3a', price: 14.99, rating: 4.1 },
      { id: 5, key: 'clock', title: "The Clockmaker's Paradox", author: 'Iris Vale', genre: 'Science Fiction', color: '#b5452f', price: 16.2, rating: 4.5 },
      { id: 6, key: 'glass', title: 'Gardens in Glass', author: 'June Park', genre: 'Gardening', color: '#2a9d8f', price: 22.5, rating: 4.4 },
    ];
    const units = {        // units sold per month, January 2025 to August 2026
      1: [40, 47, 46, 47, 57, 51, 46, 54, 60, 60, 71, 111, 52, 42, 49, 56, 59, 48, 53, 51],
      2: [40, 37, 35, 41, 48, 43, 40, 42, 50, 53, 53, 84, 42, 35, 38, 41, 45, 41, 46, 46],
      3: [46, 45, 41, 46, 53, 49, 46, 45, 60, 51, 63, 100, 48, 48, 49, 48, 53, 49, 48, 52],
      4: [100, 80, 72, 70, 66, 66],                    // released March 2026
      5: [48, 47, 54, 52, 65, 55, 57, 58, 64, 66, 75, 124, 58, 49, 59, 56, 63, 57, 54, 57],
      6: [31, 30, 28, 35, 31, 32, 29, 30, 41, 36, 45, 64, 31, 30, 30, 38, 40, 38, 36, 38],
    };
    const months = d3.utcMonths(new Date('2025-01-01'), new Date('2026-09-01')).map(d3.utcFormat('%Y-%m'));
    const sales = books.flatMap(b => units[b.id].map((n, i) =>
      ({ month: months[i + months.length - units[b.id].length], book: b.id, units: n })));
    const ratings = [[4, 8, 20, 87, 293], [6, 10, 22, 95, 147], [2, 3, 8, 45, 342], [2, 3, 8, 24, 28],
      [4, 8, 20, 90, 228], [4, 7, 20, 82, 147]].map((counts, i) => ({ book: i + 1, counts }));  // 1 to 5 stars
    const regions = [{ id: '826', name: 'United Kingdom', units: 1480 }, { id: '276', name: 'Germany', units: 1120 },
      { id: '250', name: 'France', units: 760 }, { id: '372', name: 'Ireland', units: 540 },
      { id: '528', name: 'Netherlands', units: 410 }, { id: '724', name: 'Spain', units: 320 }];
    const links = [[5, 1, 38], [1, 3, 24], [2, 5, 18], [3, 6, 21], [4, 1, 12], [2, 6, 9], [4, 3, 15], [5, 6, 14]]
      .map(([source, target, value]) => ({ source, target, value }));   // customers who bought both
    return { books, sales, ratings, regions, links };
  })();

  const books = SALES.books.map(b => ({ ...b,
    units: d3.sum(SALES.sales.filter(s => s.book === b.id), s => s.units) }));
  const svg = d3.select('svg');

  function draw(data) {
    return svg.selectAll('g').data(data, d => d.id)          // keyed by id, not by position
      .join(enter => {
        const g = enter.append('g').attr('transform', (d, i) => `translate(0, ${i * 31})`);
        g.append('rect').attr('height', 26).attr('fill', d => d.color);
        g.append('text').attr('x', 6).attr('y', 18).attr('fill', 'white').text(d => d.title);
        g.append('text').attr('class', 'n').attr('y', 18).text(d => d.units);
        return g;
      })
      .call(g => g.select('rect').attr('width', d => d.units / 2.4))
      .call(g => g.select('.n').attr('x', d => d.units / 2.4 + 6))
      .transition().duration(600)                             // each group glides to its new row
      .attr('transform', (d, i) => `translate(0, ${i * 31})`)
      .selection();
  }

  const first = draw(books).nodes();
  const sorts = {
    units: () => d3.sort(books, d => -d.units),
    title: () => d3.sort(books, d => d.title.replace(/^The /, '')),
    catalog: () => books,
  };
  for (const [id, sort] of Object.entries(sorts)) {
    document.getElementById(id).onclick = () => {
      const nodes = draw(sort()).order().nodes();             // order() moves the DOM nodes too
      d3.select('#out').text(`elements reused: ${nodes.every(n => first.includes(n))}`);
    };
  }
  document.getElementById('units').click();                   // best seller first
</script>