orders(), saved as booknest-orders.js, simulates web orders (hour, basket value) from a seeded random source. The page draws 50,000 on a canvas and times it against rendering the same points as SVG circles:
<script src="https://cdn.jsdelivr.net/npm/d3@7.9.0/dist/d3.min.js"></script>
<canvas width="620" height="160"></canvas><p id="t" style="font:12px Arial;margin:4px 0"></p>
<script>
function orders(n) {                             // simulated and seeded: same every run
  const rand = d3.randomLcg(42), hour = d3.randomNormal.source(rand)(14, 4);
  const value = d3.randomLogNormal.source(rand)(3.2, 0.45);
  return Array.from({ length: n }, () => ({ hour: (hour() + 24) % 24, value: value() }));
}
const points = orders(50000);
const x = d3.scaleLinear([0, 24], [40, 610]), y = d3.scaleLog([5, 200], [155, 5]);
const ctx = document.querySelector('canvas').getContext('2d');
let t0 = performance.now();
ctx.fillStyle = 'rgba(31, 95, 139, 0.3)';                   // set state once, not per point
for (const p of points) ctx.fillRect(x(p.hour) - 1, y(p.value) - 1, 2, 2);
const canvasMs = performance.now() - t0;
const svg = d3.select('body').append('svg').attr('width', 620).attr('height', 160);
t0 = performance.now();
svg.selectAll('circle').data(points).join('circle').attr('r', 1).attr('fill', '#1f5f8b')
  .attr('cx', p => x(p.hour)).attr('cy', p => y(p.value));
requestAnimationFrame(() => setTimeout(() => {              // after style, layout and paint
  const svgMs = performance.now() - t0;
  svg.remove();
  d3.select('#t').text(`canvas ${canvasMs.toFixed(0)} ms, SVG ${svgMs.toFixed(0)} ms`);
  window.__done = true;
}));
</script>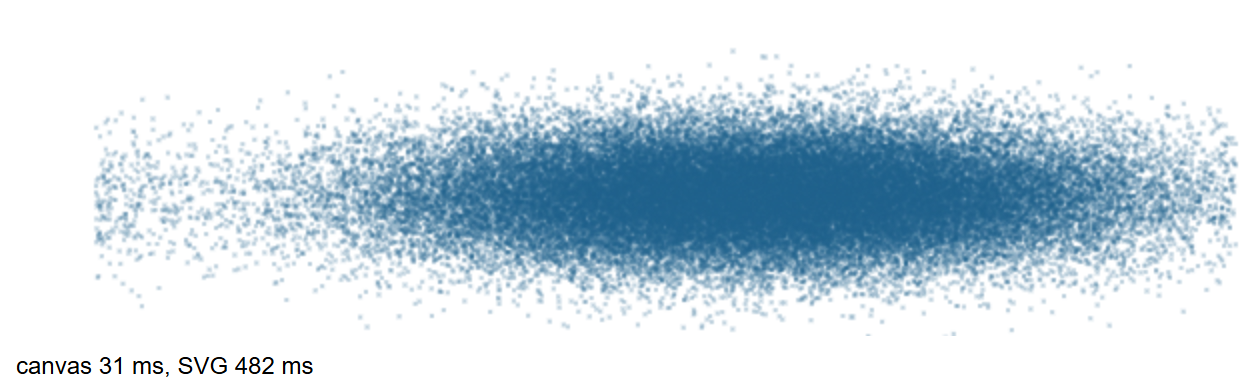
On this shared 4-CPU machine the figure's run measured 31 against 482 ms, and earlier runs 27/406 and 35/437: SVG took 12 to 16 times as long (absolute times vary with load). fillRect squares instead of arc circles and one fillStyle for all points keep the loop fast. Past a few hundred thousand points, use WebGL (WebGL) or aggregate with d3.bin or a hexbin.