Vega-Lite 126 (github.com/vega/vega-lite (https://github.com/vega/vega-lite 5,497 ), from the University of Washington's Interactive Data Lab) writes the grammar as JSON, so tools such as Python's Altair 126 can generate it. It compiles to a Vega 126 spec that the Vega runtime draws; vega-embed 7.3.0 wires them together. The join to catalog titles, the sum and the sort all happen inside the spec:
<script src="https://cdn.jsdelivr.net/npm/vega@6.4.0/build/vega.min.js"></script>
<script src="https://cdn.jsdelivr.net/npm/vega-lite@6.4.3/build/vega-lite.min.js"></script>
<script src="https://cdn.jsdelivr.net/npm/vega-embed@7.3.0/build/vega-embed.min.js"></script>
<script src="booknest-sales.js"></script>
<div id="vl"></div>
<script>
  vegaEmbed('#vl', {
    $schema: 'https://vega.github.io/schema/vega-lite/v6.json', width: 400, height: 130,
    data: { values: SALES.sales },                     // the 106 raw rows: month, book, units
    transform: [{ lookup: 'book',                      // join each row to its catalog title
      from: { data: { values: SALES.books }, key: 'id', fields: ['title'] } }],
    mark: 'bar',
    encoding: {
      y: { field: 'title', type: 'nominal', sort: '-x', title: null },
      x: { aggregate: 'sum', field: 'units', title: 'Units sold' },
      color: { field: 'title', legend: null, scale: {
        domain: SALES.books.map(b => b.title), range: SALES.books.map(b => b.color) } }
    }
  }, { renderer: 'svg', actions: false }).then(() => { window.__done = true; });
</script>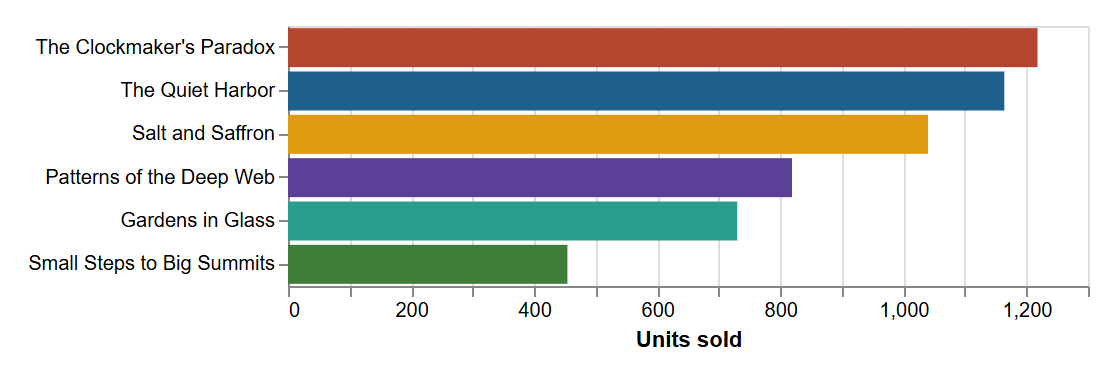
Declarative also means silent: a draft that added as: 'info' to the lookup and encoded info.title drew one empty band labeled undefined, with nothing in the console, so validate specs against their $schema. A params selection adds hover highlights or brushing without event code.
<!doctype html>
<style>
  body { margin: 0; padding: 8px; background: #fafaf7; font: 12px system-ui, sans-serif; color: #263238; }
</style>
<script src="https://cdn.jsdelivr.net/npm/d3@7.9.0/dist/d3.min.js"></script>
<script src="https://cdn.jsdelivr.net/npm/vega@6.4.0/build/vega.min.js"></script>
<script src="https://cdn.jsdelivr.net/npm/vega-lite@6.4.3/build/vega-lite.min.js"></script>
<script src="https://cdn.jsdelivr.net/npm/vega-embed@7.3.0/build/vega-embed.min.js"></script>
<div id="vl"></div>
<script>
  // BookNest sample data, invented for these examples (not real sales)
  const SALES = (() => {
    const books = [
      { id: 1, key: 'harbor', title: 'The Quiet Harbor', author: 'Elena Marsh', genre: 'Fiction', color: '#1f5f8b', price: 18.99, rating: 4.6 },
      { id: 2, key: 'deepweb', title: 'Patterns of the Deep Web', author: 'Ravi Menon', genre: 'Technology', color: '#5b3f99', price: 39.5, rating: 4.3 },
      { id: 3, key: 'saffron', title: 'Salt and Saffron', author: 'Leila Haddad', genre: 'Cooking', color: '#e09a10', price: 24, rating: 4.8 },
      { id: 4, key: 'summit', title: 'Small Steps to Big Summits', author: 'Tom Okafor', genre: 'Self-Help', color: '#3f7d3a', price: 14.99, rating: 4.1 },
      { id: 5, key: 'clock', title: "The Clockmaker's Paradox", author: 'Iris Vale', genre: 'Science Fiction', color: '#b5452f', price: 16.2, rating: 4.5 },
      { id: 6, key: 'glass', title: 'Gardens in Glass', author: 'June Park', genre: 'Gardening', color: '#2a9d8f', price: 22.5, rating: 4.4 },
    ];
    const units = {        // units sold per month, January 2025 to August 2026
      1: [40, 47, 46, 47, 57, 51, 46, 54, 60, 60, 71, 111, 52, 42, 49, 56, 59, 48, 53, 51],
      2: [40, 37, 35, 41, 48, 43, 40, 42, 50, 53, 53, 84, 42, 35, 38, 41, 45, 41, 46, 46],
      3: [46, 45, 41, 46, 53, 49, 46, 45, 60, 51, 63, 100, 48, 48, 49, 48, 53, 49, 48, 52],
      4: [100, 80, 72, 70, 66, 66],                    // released March 2026
      5: [48, 47, 54, 52, 65, 55, 57, 58, 64, 66, 75, 124, 58, 49, 59, 56, 63, 57, 54, 57],
      6: [31, 30, 28, 35, 31, 32, 29, 30, 41, 36, 45, 64, 31, 30, 30, 38, 40, 38, 36, 38],
    };
    const months = d3.utcMonths(new Date('2025-01-01'), new Date('2026-09-01')).map(d3.utcFormat('%Y-%m'));
    const sales = books.flatMap(b => units[b.id].map((n, i) =>
      ({ month: months[i + months.length - units[b.id].length], book: b.id, units: n })));
    const ratings = [[4, 8, 20, 87, 293], [6, 10, 22, 95, 147], [2, 3, 8, 45, 342], [2, 3, 8, 24, 28],
      [4, 8, 20, 90, 228], [4, 7, 20, 82, 147]].map((counts, i) => ({ book: i + 1, counts }));  // 1 to 5 stars
    const regions = [{ id: '826', name: 'United Kingdom', units: 1480 }, { id: '276', name: 'Germany', units: 1120 },
      { id: '250', name: 'France', units: 760 }, { id: '372', name: 'Ireland', units: 540 },
      { id: '528', name: 'Netherlands', units: 410 }, { id: '724', name: 'Spain', units: 320 }];
    const links = [[5, 1, 38], [1, 3, 24], [2, 5, 18], [3, 6, 21], [4, 1, 12], [2, 6, 9], [4, 3, 15], [5, 6, 14]]
      .map(([source, target, value]) => ({ source, target, value }));   // customers who bought both
    return { books, sales, ratings, regions, links };
  })();

  // The whole chart is JSON: the join to titles, the sum and the sort happen inside the spec
  vegaEmbed('#vl', {
    $schema: 'https://vega.github.io/schema/vega-lite/v6.json', width: 400, height: 150,
    data: { values: SALES.sales },                     // the 106 raw rows: month, book, units
    transform: [{ lookup: 'book',                      // join each row to its catalog title
      from: { data: { values: SALES.books }, key: 'id', fields: ['title'] } }],
    params: [{ name: 'hover', select: { type: 'point', on: 'pointerover', fields: ['title'] } }],   // no event code
    mark: { type: 'bar', cursor: 'pointer' },
    encoding: {
      y: { field: 'title', type: 'nominal', sort: '-x', title: null },
      x: { aggregate: 'sum', field: 'units', title: 'Units sold' },
      color: { field: 'title', legend: null, scale: {
        domain: SALES.books.map(b => b.title), range: SALES.books.map(b => b.color) } },
      opacity: { condition: { param: 'hover', empty: true, value: 1 }, value: 0.35 },
      tooltip: [{ field: 'title' }, { aggregate: 'sum', field: 'units', title: 'units' }],
    },
  }, { renderer: 'svg', actions: false });
</script>