d3.scaleBand() divides a range into one equal band per category and reports each band's start and its bandwidth(); paddingInner sets the gap between bands as a fraction of the step, paddingOuter the ends. d3.scalePoint() is a band scale with zero width, for dot plots and lines through categories:
<script src="https://cdn.jsdelivr.net/npm/d3@7.9.0/dist/d3.min.js"></script>
<script src="booknest-sales.js"></script>
<svg width="620" height="140" font-family="Arial" font-size="13"></svg>
<script>
  const books = SALES.books.map(b => ({ ...b,
    units: d3.sum(SALES.sales, s => s.book === b.id ? s.units : 0) }));
  const keys = books.map(d => d.key), svg = d3.select('svg');
  const x = d3.scaleBand(keys, [0, 600]).paddingInner(0.2).paddingOuter(0.1);
  const p = d3.scalePoint(keys, [0, 600]).padding(0.5);           // band centers
  const y = d3.scaleLinear([0, d3.max(books, d => d.units)], [118, 0]);
  svg.selectAll('rect').data(books).join('rect').attr('fill', d => d.color)
    .attr('x', d => x(d.key)).attr('width', x.bandwidth())
    .attr('y', d => y(d.units)).attr('height', d => 118 - y(d.units));
  svg.selectAll('text').data(books).join('text').text(d => d.key)
    .attr('x', d => p(d.key)).attr('y', 136).attr('text-anchor', 'middle');
</script>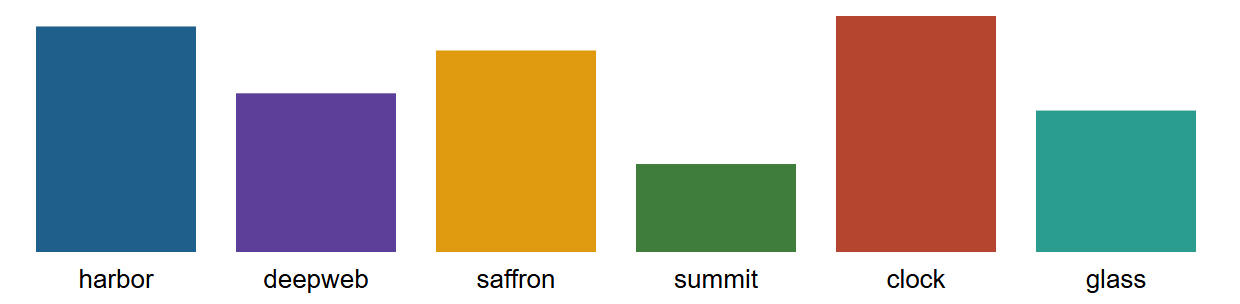
Here x.step() is 100 and x.bandwidth() 80, so clock's band starts at 410 and its label sits at p('clock'), 450, the band's center. That works only because an outer padding of half the inner padding gives both scales a step of 100; otherwise use x(d.key) + x.bandwidth() / 2. An unknown category returns undefined, which the browser rejects silently, and band scales have no unknown() fallback.
<!doctype html>
<style>
  body { margin: 0; padding: 8px; background: #fafaf7; font: 13px system-ui, sans-serif; color: #263238; }
  svg { width: 100%; max-width: 600px; display: block; background: #fff; }
  label { margin-right: 12px; }
</style>
<script src="https://cdn.jsdelivr.net/npm/d3@7.9.0/dist/d3.min.js"></script>
<p><label>paddingInner <input type="range" id="inner" min="0" max="0.9" step="0.05" value="0.2"></label>
   <label>paddingOuter <input type="range" id="outer" min="0" max="1" step="0.05" value="0.1"></label></p>
<svg viewBox="0 0 600 170" font-size="13"></svg>
<p id="out"></p>
<script>
  // BookNest sample data, invented for these examples (not real sales)
  const SALES = (() => {
    const books = [
      { id: 1, key: 'harbor', title: 'The Quiet Harbor', author: 'Elena Marsh', genre: 'Fiction', color: '#1f5f8b', price: 18.99, rating: 4.6 },
      { id: 2, key: 'deepweb', title: 'Patterns of the Deep Web', author: 'Ravi Menon', genre: 'Technology', color: '#5b3f99', price: 39.5, rating: 4.3 },
      { id: 3, key: 'saffron', title: 'Salt and Saffron', author: 'Leila Haddad', genre: 'Cooking', color: '#e09a10', price: 24, rating: 4.8 },
      { id: 4, key: 'summit', title: 'Small Steps to Big Summits', author: 'Tom Okafor', genre: 'Self-Help', color: '#3f7d3a', price: 14.99, rating: 4.1 },
      { id: 5, key: 'clock', title: "The Clockmaker's Paradox", author: 'Iris Vale', genre: 'Science Fiction', color: '#b5452f', price: 16.2, rating: 4.5 },
      { id: 6, key: 'glass', title: 'Gardens in Glass', author: 'June Park', genre: 'Gardening', color: '#2a9d8f', price: 22.5, rating: 4.4 },
    ];
    const units = {        // units sold per month, January 2025 to August 2026
      1: [40, 47, 46, 47, 57, 51, 46, 54, 60, 60, 71, 111, 52, 42, 49, 56, 59, 48, 53, 51],
      2: [40, 37, 35, 41, 48, 43, 40, 42, 50, 53, 53, 84, 42, 35, 38, 41, 45, 41, 46, 46],
      3: [46, 45, 41, 46, 53, 49, 46, 45, 60, 51, 63, 100, 48, 48, 49, 48, 53, 49, 48, 52],
      4: [100, 80, 72, 70, 66, 66],                    // released March 2026
      5: [48, 47, 54, 52, 65, 55, 57, 58, 64, 66, 75, 124, 58, 49, 59, 56, 63, 57, 54, 57],
      6: [31, 30, 28, 35, 31, 32, 29, 30, 41, 36, 45, 64, 31, 30, 30, 38, 40, 38, 36, 38],
    };
    const months = d3.utcMonths(new Date('2025-01-01'), new Date('2026-09-01')).map(d3.utcFormat('%Y-%m'));
    const sales = books.flatMap(b => units[b.id].map((n, i) =>
      ({ month: months[i + months.length - units[b.id].length], book: b.id, units: n })));
    const ratings = [[4, 8, 20, 87, 293], [6, 10, 22, 95, 147], [2, 3, 8, 45, 342], [2, 3, 8, 24, 28],
      [4, 8, 20, 90, 228], [4, 7, 20, 82, 147]].map((counts, i) => ({ book: i + 1, counts }));  // 1 to 5 stars
    const regions = [{ id: '826', name: 'United Kingdom', units: 1480 }, { id: '276', name: 'Germany', units: 1120 },
      { id: '250', name: 'France', units: 760 }, { id: '372', name: 'Ireland', units: 540 },
      { id: '528', name: 'Netherlands', units: 410 }, { id: '724', name: 'Spain', units: 320 }];
    const links = [[5, 1, 38], [1, 3, 24], [2, 5, 18], [3, 6, 21], [4, 1, 12], [2, 6, 9], [4, 3, 15], [5, 6, 14]]
      .map(([source, target, value]) => ({ source, target, value }));   // customers who bought both
    return { books, sales, ratings, regions, links };
  })();

  const books = SALES.books.map(b => ({ ...b,
    units: d3.sum(SALES.sales, s => s.book === b.id ? s.units : 0) }));
  const keys = books.map(d => d.key), svg = d3.select('svg');
  const y = d3.scaleLinear([0, d3.max(books, d => d.units)], [128, 8]);

  function draw() {
    const inner = +d3.select('#inner').property('value'), outer = +d3.select('#outer').property('value');
    const x = d3.scaleBand(keys, [0, 600]).paddingInner(inner).paddingOuter(outer);
    const p = d3.scalePoint(keys, [0, 600]).padding(0.5);          // zero-width bands: the centers
    svg.selectAll('rect').data(books).join('rect').attr('fill', d => d.color)
      .attr('x', d => x(d.key)).attr('width', x.bandwidth())
      .attr('y', d => y(d.units)).attr('height', d => 128 - y(d.units));
    svg.selectAll('text.k').data(books).join('text').attr('class', 'k').text(d => d.key)
      .attr('x', d => x(d.key) + x.bandwidth() / 2).attr('y', 146).attr('text-anchor', 'middle');
    svg.selectAll('circle').data(books).join('circle').attr('r', 3).attr('fill', '#263238')
      .attr('cx', d => p(d.key)).attr('cy', 162);
    d3.select('#out').text(`step ${x.step().toFixed(1)} · bandwidth ${x.bandwidth().toFixed(1)} · ` +
      `x('clock') = ${x('clock').toFixed(1)} · dots: scalePoint centers with padding 0.5`);
  }
  d3.selectAll('input').on('input', draw);
  draw();
</script>