Three MIT libraries package D3 with React's split, with D3 18,089 's d3-scale and d3-shape inside. Recharts 126 (github.com/recharts/recharts (https://github.com/recharts/recharts 27,595 )) composes charts from JSX components; Nivo (github.com/plouc/nivo (https://github.com/plouc/nivo 14,102 )) takes one component with a large configuration and animates with react-spring; visx 21,064 (github.com/airbnb/visx (https://github.com/airbnb/visx 21,064 ), from Airbnb) supplies primitives and leaves the layout to you:
import { BarChart, Bar, XAxis, YAxis, Cell } from 'recharts';
import { Bar as NivoBar } from '@nivo/bar';
import { scaleBand, scaleLinear } from '@visx/scale';
import { Bar as VisxBar } from '@visx/shape';
import { Group } from '@visx/group'; import { AxisLeft } from '@visx/axis';
export const RechartsBars = ({ rows }) => (
  <BarChart width={560} height={180} data={rows} layout="vertical">
    <XAxis type="number" /><YAxis type="category" dataKey="title" width={170} />
    <Bar dataKey="units" isAnimationActive={false}>
      {rows.map(r => <Cell key={r.title} fill={r.color} />)}</Bar>
  </BarChart>);
export const NivoBars = ({ rows }) => (
  <NivoBar data={rows.toReversed()} keys={['units']} indexBy="title" layout="horizontal"
    width={560} height={180} margin={{ left: 170, right: 20, bottom: 30 }}
    colors={d => d.data.color} enableLabel={false} animate={false} />);
export function VisxBars({ rows, width = 560, height = 180 }) {
  const y = scaleBand({ domain: rows.map(r => r.title), range: [0, height], padding: 0.2 });
  const x = scaleLinear({ domain: [0, rows[0].units], range: [0, width - 170] });
  return <svg width={width} height={height}><Group left={170}>
    {rows.map(r => <VisxBar key={r.title} y={y(r.title)} height={y.bandwidth()}
      width={x(r.units)} fill={r.color} />)}
    <AxisLeft scale={y} hideTicks /></Group></svg>;
}
Bundled with esbuild 126 and run in Chrome 154 1 on React 19.3.0 7,897 with TOTALS as rows, each drew the six bars in order.
Plotly.js 26,036 (github.com/plotly/plotly.js (https://github.com/plotly/plotly.js 18,348 )) is framework-free, with a React wrapper (react-plotly.js 4.1.0). Built on its own fork of D3 3 and on regl 5,583 for WebGL, it ships 3D, statistical, financial and map traces; 4.0.0 (24 August 2026) dropped the Mapbox 1,919 traces for MapLibre 34,367 ones. The full bundle is 4.8 MB minified, so this page loads the 1.2 MB basic one:
<script src="https://cdn.jsdelivr.net/npm/plotly.js-basic-dist-min@4.1.1/plotly-basic.min.js">
</script>
<script src="booknest-sales.js"></script><script src="booknest-totals.js"></script>
<div id="pl"></div>
<script>
  const rows = TOTALS.toReversed();          // Plotly puts the first category at the bottom
  Plotly.newPlot('pl', [{ type: 'bar', orientation: 'h', x: rows.map(r => r.units),
    y: rows.map(r => r.title), marker: { color: rows.map(r => r.color) } }],
    { width: 560, height: 180, margin: { l: 160, r: 20, t: 10, b: 30 }, font: { size: 11 },
      yaxis: { ticksuffix: ' ' } },
    { displayModeBar: false }).then(() => { window.__done = true; });
</script>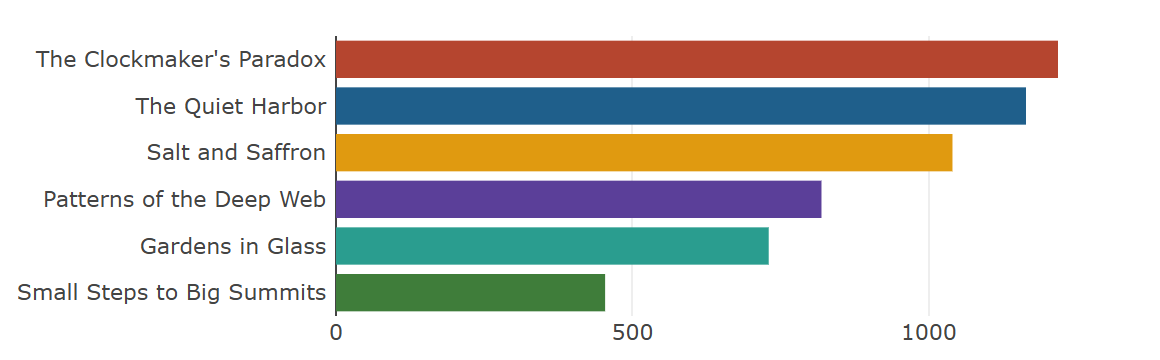
Pick Recharts for standard React dashboards, visx or plain D3 math for bespoke React charts, and Plotly for scientific plots in 3D or WebGL.
<!doctype html>
<style>
  body { margin: 0; padding: 8px; background: #fafaf7; font: 12px system-ui, sans-serif; color: #263238; }
</style>
<script src="https://cdn.jsdelivr.net/npm/d3@7.9.0/dist/d3.min.js"></script>
<script src="https://cdn.jsdelivr.net/npm/plotly.js-basic-dist-min@4.1.1/plotly-basic.min.js"></script>
<div id="pl"></div>
<p>Recharts, Nivo and visx need a React build step; Plotly.js runs from a script tag. Hover a bar.</p>
<script>
  // BookNest sample data, invented for these examples (not real sales)
  const SALES = (() => {
    const books = [
      { id: 1, key: 'harbor', title: 'The Quiet Harbor', author: 'Elena Marsh', genre: 'Fiction', color: '#1f5f8b', price: 18.99, rating: 4.6 },
      { id: 2, key: 'deepweb', title: 'Patterns of the Deep Web', author: 'Ravi Menon', genre: 'Technology', color: '#5b3f99', price: 39.5, rating: 4.3 },
      { id: 3, key: 'saffron', title: 'Salt and Saffron', author: 'Leila Haddad', genre: 'Cooking', color: '#e09a10', price: 24, rating: 4.8 },
      { id: 4, key: 'summit', title: 'Small Steps to Big Summits', author: 'Tom Okafor', genre: 'Self-Help', color: '#3f7d3a', price: 14.99, rating: 4.1 },
      { id: 5, key: 'clock', title: "The Clockmaker's Paradox", author: 'Iris Vale', genre: 'Science Fiction', color: '#b5452f', price: 16.2, rating: 4.5 },
      { id: 6, key: 'glass', title: 'Gardens in Glass', author: 'June Park', genre: 'Gardening', color: '#2a9d8f', price: 22.5, rating: 4.4 },
    ];
    const units = {        // units sold per month, January 2025 to August 2026
      1: [40, 47, 46, 47, 57, 51, 46, 54, 60, 60, 71, 111, 52, 42, 49, 56, 59, 48, 53, 51],
      2: [40, 37, 35, 41, 48, 43, 40, 42, 50, 53, 53, 84, 42, 35, 38, 41, 45, 41, 46, 46],
      3: [46, 45, 41, 46, 53, 49, 46, 45, 60, 51, 63, 100, 48, 48, 49, 48, 53, 49, 48, 52],
      4: [100, 80, 72, 70, 66, 66],                    // released March 2026
      5: [48, 47, 54, 52, 65, 55, 57, 58, 64, 66, 75, 124, 58, 49, 59, 56, 63, 57, 54, 57],
      6: [31, 30, 28, 35, 31, 32, 29, 30, 41, 36, 45, 64, 31, 30, 30, 38, 40, 38, 36, 38],
    };
    const months = d3.utcMonths(new Date('2025-01-01'), new Date('2026-09-01')).map(d3.utcFormat('%Y-%m'));
    const sales = books.flatMap(b => units[b.id].map((n, i) =>
      ({ month: months[i + months.length - units[b.id].length], book: b.id, units: n })));
    const ratings = [[4, 8, 20, 87, 293], [6, 10, 22, 95, 147], [2, 3, 8, 45, 342], [2, 3, 8, 24, 28],
      [4, 8, 20, 90, 228], [4, 7, 20, 82, 147]].map((counts, i) => ({ book: i + 1, counts }));  // 1 to 5 stars
    const regions = [{ id: '826', name: 'United Kingdom', units: 1480 }, { id: '276', name: 'Germany', units: 1120 },
      { id: '250', name: 'France', units: 760 }, { id: '372', name: 'Ireland', units: 540 },
      { id: '528', name: 'Netherlands', units: 410 }, { id: '724', name: 'Spain', units: 320 }];
    const links = [[5, 1, 38], [1, 3, 24], [2, 5, 18], [3, 6, 21], [4, 1, 12], [2, 6, 9], [4, 3, 15], [5, 6, 14]]
      .map(([source, target, value]) => ({ source, target, value }));   // customers who bought both
    return { books, sales, ratings, regions, links };
  })();

  const TOTALS = d3.sort(SALES.books.map(b => ({ title: b.title, color: b.color,
    units: d3.sum(SALES.sales, s => s.book === b.id ? s.units : 0) })), r => -r.units);
  const rows = TOTALS.toReversed();                 // Plotly puts the first category at the bottom
  Plotly.newPlot('pl', [{
    type: 'bar', orientation: 'h', x: rows.map(r => r.units), y: rows.map(r => r.title),
    marker: { color: rows.map(r => r.color) }, hovertemplate: '%{y}: %{x} units<extra></extra>',
  }], {
    width: 580, height: 220, margin: { l: 180, r: 20, t: 10, b: 30 }, font: { size: 11 },
    paper_bgcolor: '#fafaf7', plot_bgcolor: '#ffffff', yaxis: { ticksuffix: ' ' },
  }, { displayModeBar: false });
</script>