Network
The Network panel records requests only while DevTools is open, so open it first and reload. Each row shows status, type, initiator (the script or tag that caused it), size and a waterfall bar. A request's Timing tab splits its time into queueing, DNS lookup, connection, TLS, waiting for server response (time to first byte) and content download: a long wait points at the server, a long download at the payload.
Tick Disable cache to simulate a first visit and Preserve log to keep requests across redirects; the throttling menu offers Fast 4G, Slow 4G, 3G and Offline. Filters such as status-code:404 and larger-than:100k narrow the list. Right-click a request to Copy as cURL, Block request URL or Override content. Export HAR omits Cookie and Authorization headers by default, ready for a bug report. Firefox 555 and Safari 10 offer the same waterfall and HAR export.
Performance
The Performance panel opens on live Core Web Vitals for the page as you use it, optionally compared with real-user data from the Chrome UX Report 3,948 . Google judges them at the 75th percentile of page loads; INP replaced First Input Delay on March 12, 2024.
| Metric | Measures | Good | Poor |
|---|---|---|---|
| LCP | Loading: largest image or text painted | 2.5 s or less | Over 4 s |
| INP | Responsiveness: input to next frame | 200 ms or less | Over 500 ms |
| CLS | Visual stability: unexpected shifts | 0.1 or less | Over 0.25 |
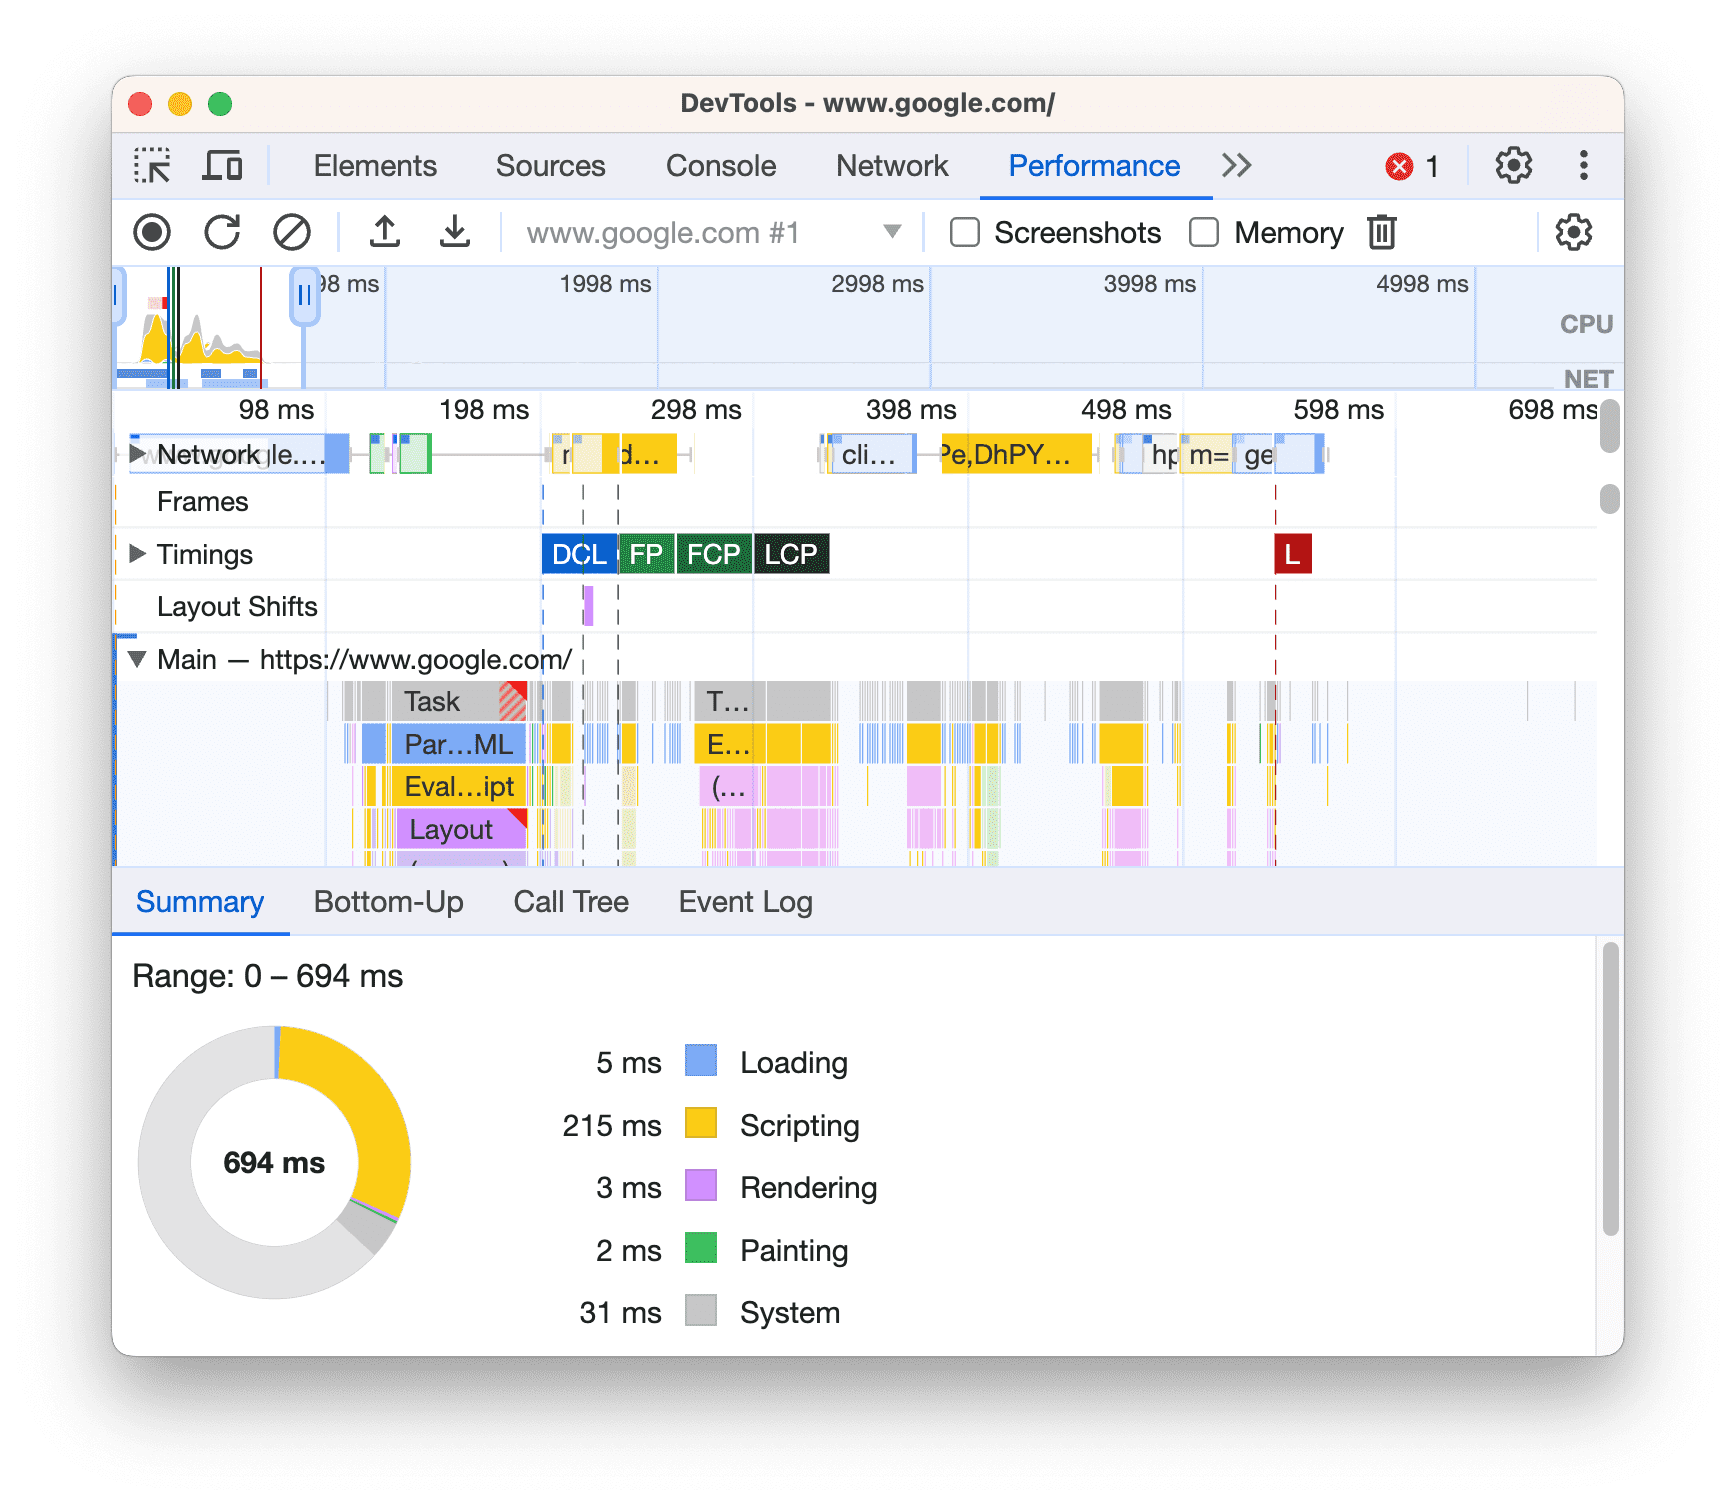
Click record, interact and stop, or click reload to profile a page load. In the Main flame chart wide bars are slow functions and a red corner marks a long task (over 50 ms); Bottom-Up ranks where the time went, and the Insights sidebar explains problems such as render-blocking requests. Since Chrome 134 1 , Calibrate in the CPU throttling menu creates mobile presets matched to your machine. Your own performance.mark() and performance.measure() calls appear in the Timings track (Web APIs).
Lighthouse
Lighthouse 30,824 is Google's open-source auditor (github.com/GoogleChrome/lighthouse (https://github.com/GoogleChrome/lighthouse 30,824 ), Apache 2.0). It scores Performance, Accessibility, Best Practices and SEO; Lighthouse 13 (October 2025) replaced many performance audits with the Performance panel's insights, and 13.3 (May 2026) added an experimental Agentic Browsing category that checks how well AI agents can use the page. The same engine runs in DevTools, on the command line, in CI and behind PageSpeed Insights 2,379 .
npm install -g lighthouse
lighthouse https://example.com --output=json --output-path=report.json --quiet
node -e "const r = require('./report.json');
for (const c of Object.values(r.categories)) console.log(c.title.padEnd(17), c.score);
console.log('LCP', r.audits['largest-contentful-paint'].displayValue);"Performance 1 Accessibility 0.96 Best Practices 0.96 SEO 0.8 Agentic Browsing 1 LCP 0.8 s
The JSON stores scores from 0 to 1 (these are example.com with Lighthouse 13.4.1, which needs Node.js 22.19 2,131 or later). By default Lighthouse emulates a Moto G Power on a slow 4G link (150 ms latency, 1.6 Mbps, 4x CPU slowdown), so scores differ from your desktop experience and vary between runs.