Your editor is where you write code; the browser's developer tools show what that code actually does. Every desktop browser ships a live DOM and CSS inspector, a console and debugger, a network recorder, a profiler, storage inspectors and device emulation, and you will use them in every chapter of this book.
The walkthroughs use Chrome DevTools 3,948 , which Chrome 1 , Edge, Opera 89 , Brave 423 and Vivaldi 6,839 share. Open it with F12 or Ctrl+Shift+I (Cmd+Option+I on macOS), or right-click an element and choose Inspect. Ctrl+Shift+P (Cmd+Shift+P) opens the Command Menu, where you can type any feature name, such as "screenshot".
| Job | Chrome and Edge | Firefox 555 | Safari 10 |
|---|---|---|---|
| DOM and CSS | Elements | Inspector | Elements |
| Breakpoints and stepping | Sources | Debugger | Sources |
| HTTP requests | Network | Network | Network |
| Runtime profiling | Performance, Memory | Performance, Memory | Timelines |
| Storage and service workers | Application | Storage, Application | Storage |
| Mobile emulation | Device Mode | Responsive Design Mode | Responsive Design Mode |
| Remote devices | chrome://inspect | about:debugging | Develop menu |
Under the hood: DevTools is a web app talking a protocol
Chrome DevTools is itself a TypeScript web app, the BSD-licensed devtools-frontend 4,058 (https://github.com/ChromeDevTools/devtools-frontend 4,058 ). It exchanges JSON messages with the browser over the Chrome DevTools Protocol (CDP), which is split into domains such as DOM, CSS, Network, Runtime and Debugger. Expanding a node in the Elements panel sends DOM.requestChildNodes; a page's console.log arrives as a Runtime.consoleAPICalled event.
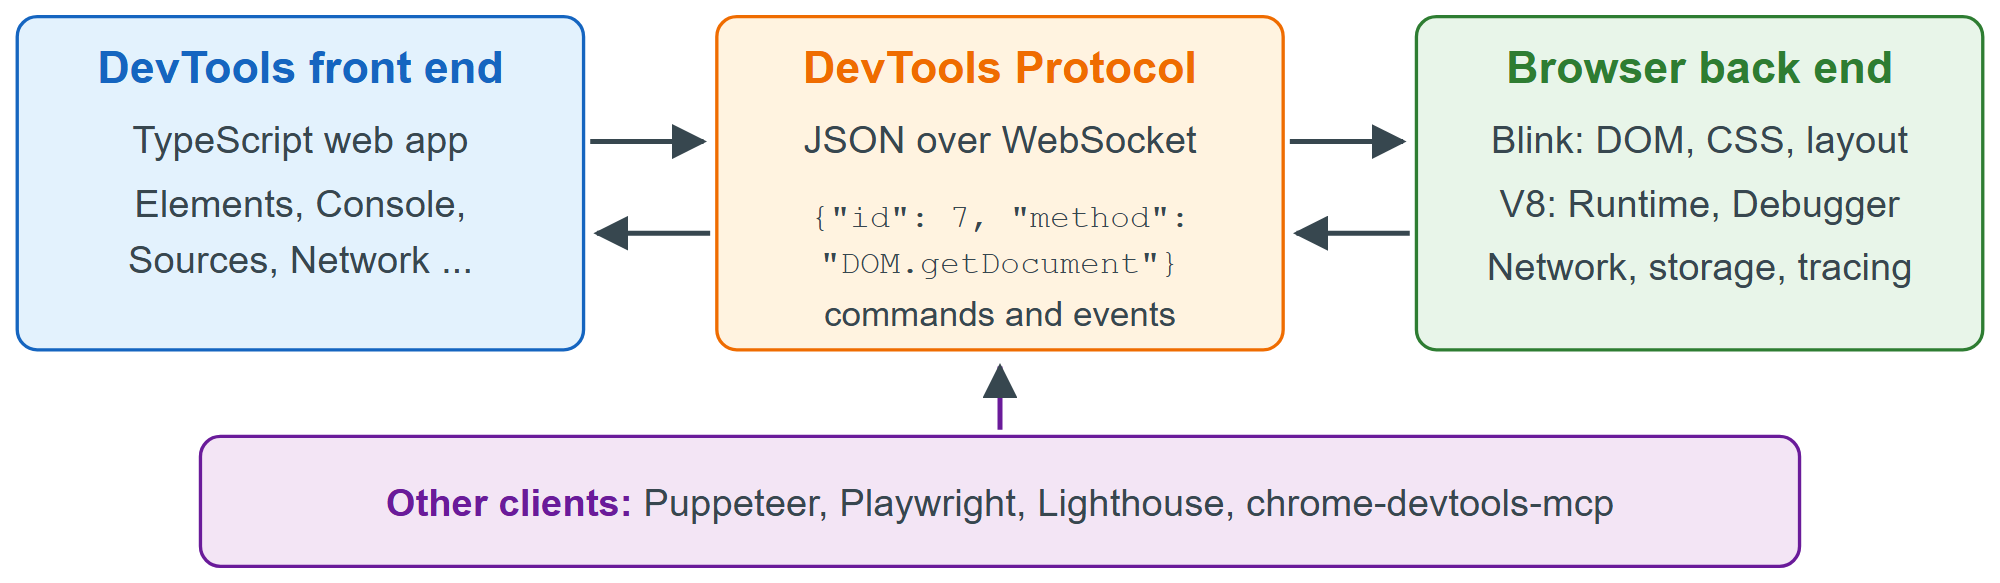
Because the protocol is public, it also powers Puppeteer 164,069 , Playwright 26,280 , Lighthouse 30,824 , the VS Code 550 debugger and remote debugging of phones (Device Mode and Remote Debug). Firefox and Safari use their own protocols; the W3C WebDriver BiDi standard is the cross-browser equivalent for automation. Since September 2025 Google has also offered chrome-devtools-mcp 52,668 (https://github.com/ChromeDevTools/chrome-devtools-mcp 52,668 ), an MCP server through which the coding agents of AI-assisted Coding open pages, read console messages and record performance traces (npx -y chrome-devtools-mcp@latest).