Once a job has two builds with results, its page draws a Test Result Trend: passed, skipped and failed counts per build. The branch's two builds show the break and the fix:
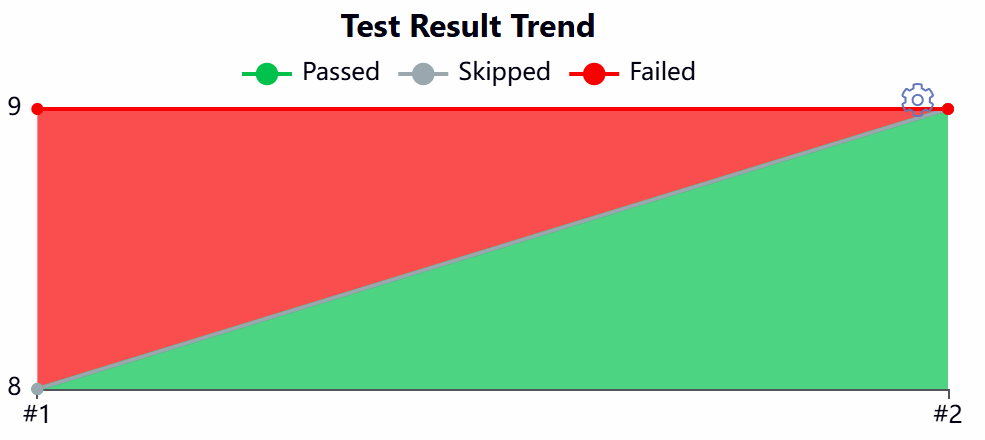
The axis starts at 8, so one failure looks large. A failing test's Age column counts how many builds it has failed, separating a new break from an old one.
A flaky test passes and fails on the same code, through timing, ordering or shared state. Retrying the whole stage (retry(2) { ... }) hides it and doubles the time of real failures. Better options:
Rerun only the failures: Node.js 2,131 has --test-rerun-failures <state file>, Maven 129 Surefire rerunFailingTestsCount, which the Flaky Test Handler plugin reports as flaky.
Quarantine: test.skip plus an issue, and watch the skipped count on the trend.
Fix the cause. BookNest's tests share one database, so none may depend on order; each only reads.