On this controller every Pipeline build has a Stages entry in its side panel (/stages after the build URL), drawn by Pipeline Graph View 163 . Build 1 of feature/id-range, the deliberately broken commit of Reports and Notifications, shows the parts at a glance:
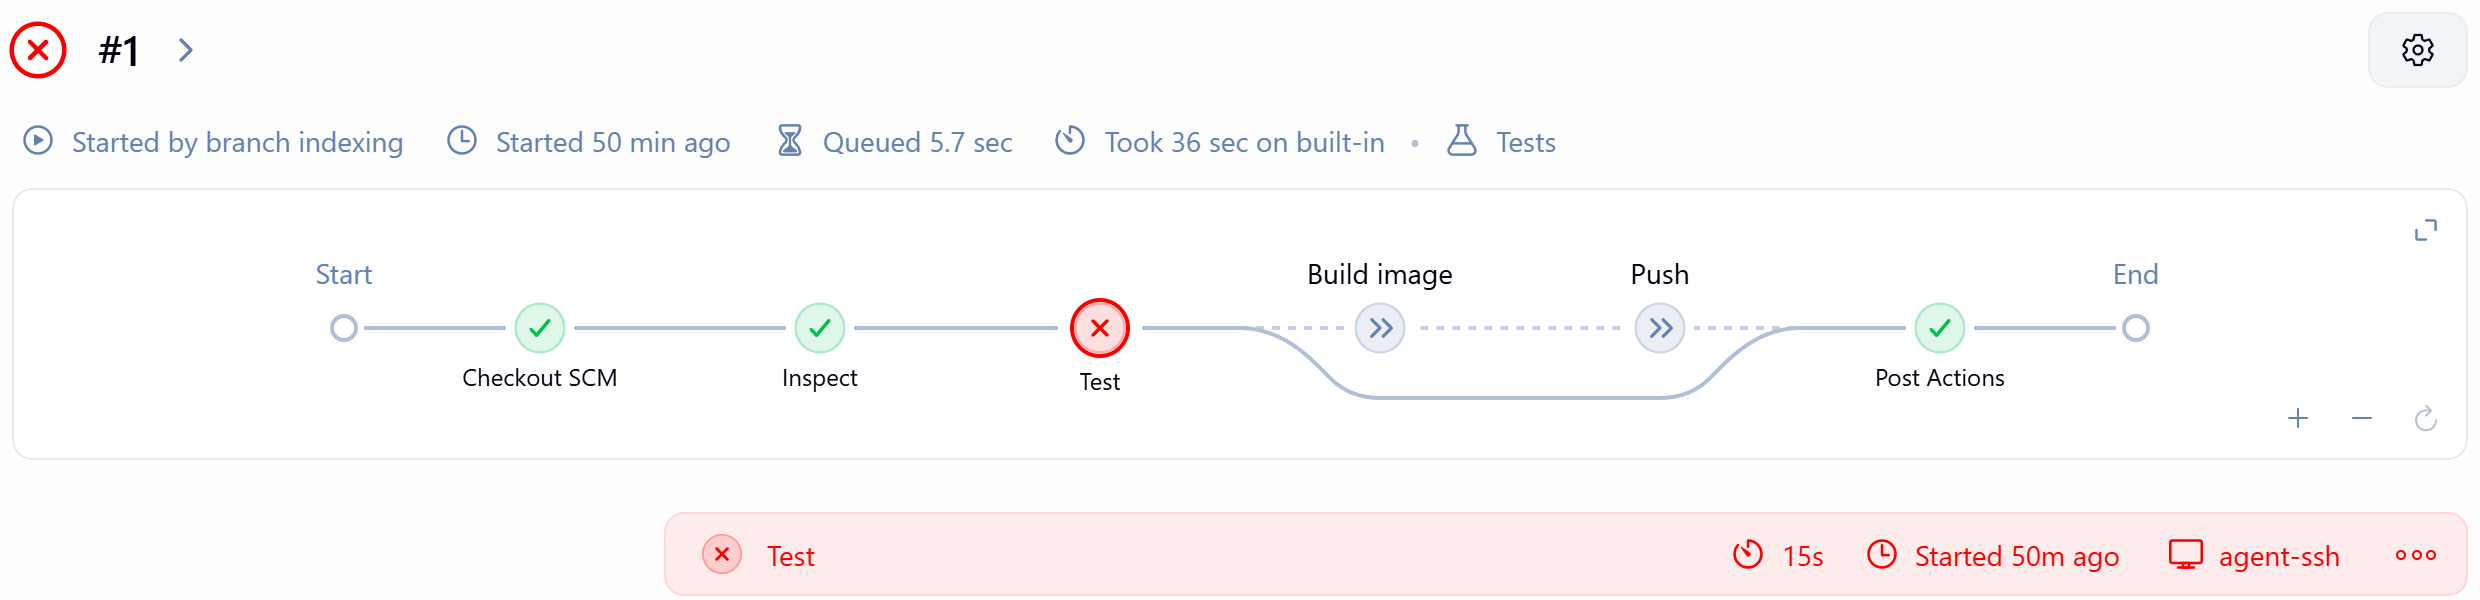
The header line gives the cause, queue time and duration; "on built-in" names the lightweight executor that runs the Pipeline's Groovy on the controller, while the red Test bar shows the stage itself ran on agent-ssh. Skipped stages keep their place, drawn with the skip symbol and a line routed around them, and post actions get a node of their own. Clicking a stage lists its steps with their durations, and a failed step opens its log at the error; here it scrolled straight to 400 !== 404, the assertion from Publishing JUnit Test Results. The graph zooms for wide parallel and matrix builds (Running Stages in parallel and The matrix Directive).
Pipeline Steps (flowGraphTable) still lists every step node with its arguments, handy when a library step misbehaves. For a grid of recent builds by stage on the job page, add Stage View; the two plugins coexist.