<progress> and <meter> both draw a horizontal bar, but they mean different things and screen readers announce them differently (progressbar versus meter role). The HTML standard is explicit: use <progress> for the completion of a task and <meter> for a measurement within a known range, also called a gauge.
<progress value="30" max="100"> shows a determinate bar at 30%. max defaults to 1.0, so value="0.3" alone means the same. Remove value and the bar becomes indeterminate: the browser animates it back and forth to say "working, but I do not know how long it will take".
<meter> takes min (default 0), max (default 1), value, and three optional hints: low, high and optimum. It suits disk usage, battery level, password strength or a match score, but not unbounded quantities such as a weight.
The hints split the range into low, middle and high regions, and optimum says which one is good. If optimum lies below low, low values are green, middle values yellow and high values red; above high, the colors reverse; and between low and high, the middle is green and both ends are yellow.
<!doctype html>
<html lang="en">
  <meta charset="utf-8">
  <style>
    body { font: 15px/1.4 system-ui, sans-serif; margin: 10px; }
    label { display: flex; justify-content: space-between; width: 520px; margin: 6px 0; }
    progress, meter { width: 260px; }
  </style>
  <label>Uploading photo.jpg <progress id="up" max="100" value="0">0%</progress></label>
  <label>Waiting for server <progress>Working...</progress></label>
  <!-- Disk: lower is better, so optimum sits below low -->
  <label>Disk 20 GB <meter max="100" low="60" high="85" optimum="10" value="20"></meter></label>
  <label>Disk 70 GB <meter max="100" low="60" high="85" optimum="10" value="70"></meter></label>
  <label>Disk 95 GB <meter max="100" low="60" high="85" optimum="10" value="95"></meter></label>
  <!-- Battery: higher is better, so optimum sits above high -->
  <label>Battery 15% <meter low="0.2" high="0.8" optimum="1" value="0.15">15%</meter></label>
  <label>Battery 90% <meter low="0.2" high="0.8" optimum="1" value="0.9">90%</meter></label>
  <script>
    const bar = document.getElementById('up');
    const timer = setInterval(() => {
      bar.value += 10;                     // a real upload would use progress events
      if (bar.value >= 60) clearInterval(timer);
    }, 100);
  </script>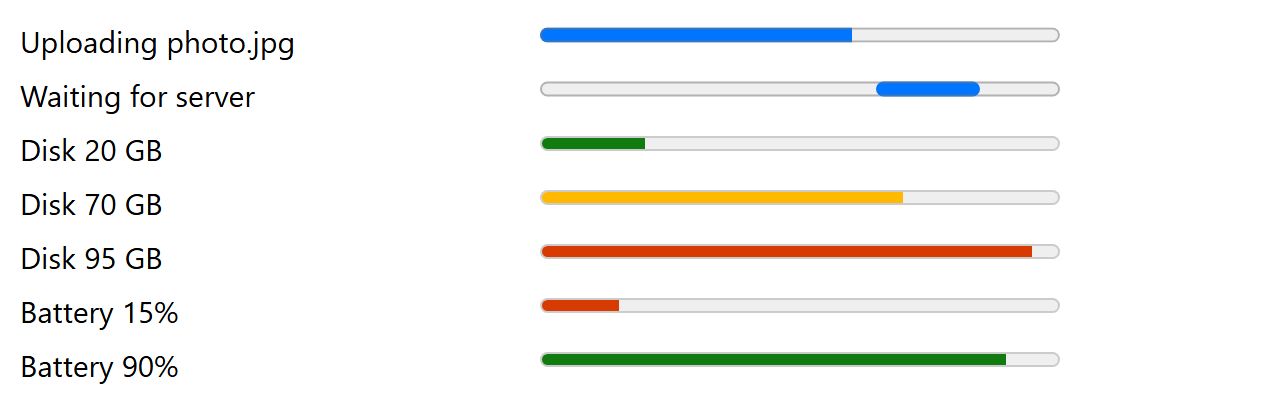
The script stops the upload bar at 60% so the capture shows a determinate state. The disk meters turn green, yellow and red as usage grows, while the battery meter is red when low and green when full: same element, opposite optimum. With real data, update value from an XMLHttpRequest progress event or a fetch() stream reader.
Practical advice
Always pair the bar with a <label> or visible text; the element's own content is shown only by user agents that do not support it, which today means none.
Keep min <= low <= high <= max; out-of-order values are clamped silently, which hides bugs.
Old references list a form attribute for <meter>. It is not part of the current standard; omit it.
Do not fake a determinate bar. If you cannot compute a fraction (a server call with no size information), leave value out and let the indeterminate animation speak for itself.
Libraries such as NProgress 26,361 (MIT) draw a thin page-top bar from plain <div> elements; it exposes no progress role, so pair it with an accessible status message.