A <table> presents data in rows and columns where both axes mean something: prices by plan and feature, sales by region and quarter. Rows are <tr>; each cell is a data cell <td> or a header cell <th>. Around them you can add:
<caption>: the title, as first child; screen readers read it on entering the table.
<thead>, <tbody> (one or more) and <tfoot>: header, body and summary row groups.
<colgroup> and <col span="2">: column groups after the caption. Only background, border, width and visibility: collapse apply to columns.
colspan and rowspan merge cells. scope (col, row, colgroup, rowgroup) on <th> states which cells a header labels; abbr gives a short header name for screen readers to repeat.
<!doctype html>
<html lang="en">
  <meta charset="utf-8">
  <style>
    body { font: 14px/1.4 system-ui, sans-serif; margin: 10px; }
    table { border-collapse: collapse; width: 600px; }
    caption { font-weight: 600; text-align: left; padding-bottom: 6px; }
    th, td { border: 1px solid #b0bec5; padding: 4px 8px; text-align: right; }
    th[scope="row"], th[scope="rowgroup"], th:first-child { text-align: left; }
    thead, tfoot { background: #eceff1; }
    .highlight { background: #fff3e0; }
  </style>
  <table>
    <caption>Sales by region, 2026 (thousand USD)</caption>
    <colgroup><col span="2"><col span="2" class="highlight"><col span="2"></colgroup>
    <thead>
      <tr><th scope="col" colspan="2">Region</th><th scope="col">Q1</th><th scope="col">Q2</th>
          <th scope="col">Q3</th><th scope="col">Total</th></tr>
    </thead>
    <tbody>
      <tr><th scope="rowgroup" rowspan="2">Americas</th><th scope="row">USA</th>
          <td>410</td><td>455</td><td>470</td><td>1,335</td></tr>
      <tr><th scope="row">Brazil</th><td>95</td><td>102</td><td>99</td><td>296</td></tr>
    </tbody>
    <tfoot>
      <tr><th scope="row" colspan="2">All regions</th>
          <td>505</td><td>557</td><td>569</td><td>1,631</td></tr>
    </tfoot>
  </table>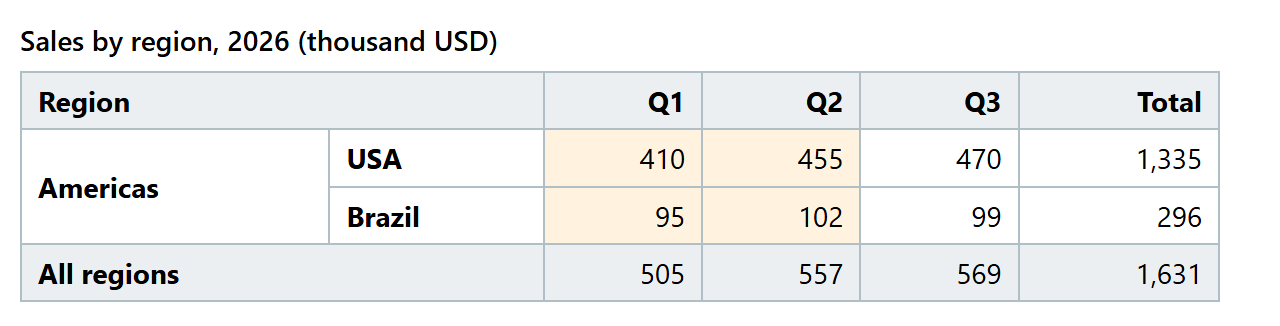
One <col> with a class highlights two columns. When scope cannot express irregular headers, give each <th> an id and list them on the data cell: <td headers="q1 brazil">.
The default table-layout: auto reads every cell before sizing columns, which is slow for thousands of rows; table-layout: fixed sizes columns from the first row. The old border, cellpadding, cellspacing, bgcolor and summary attributes are replaced by CSS (Table) and <caption>. Never use tables for page layout; if legacy markup does, add role="presentation".
On a phone, wrap a wide table in <div style="overflow-x: auto"> rather than shrinking the text. Once users need to sort, filter, page or edit thousands of rows, use a data-grid library. DataTables 6,985 (MIT) enhances an existing <table>, though editing needs its paid Editor. TanStack Table 79,069 (github.com/TanStack/table (https://github.com/TanStack/table 28,459 ), MIT) is headless: it turns rows and column definitions into a sorted, filtered, paginated row model and leaves rendering to you, for example as a virtualized list that creates DOM rows only for the visible slice (Debounce and Throttle). AG Grid 185,756 's Community edition is MIT, while pivoting and other Enterprise features cost $999 per developer; Handsontable 587,385 adds spreadsheet-style editing and is free only for non-commercial use.