The two panels marked with the React 7,897 logo come from React DevTools 7,897 . Components shows the live React tree, not the native views: search it, select a component, and the right side shows its props, state and hooks (editable while the app runs) and the components that rendered it. The Profiler records commits while you use the app and shows what each one rendered. Both are shown here on Performance Optimization's performance demo:
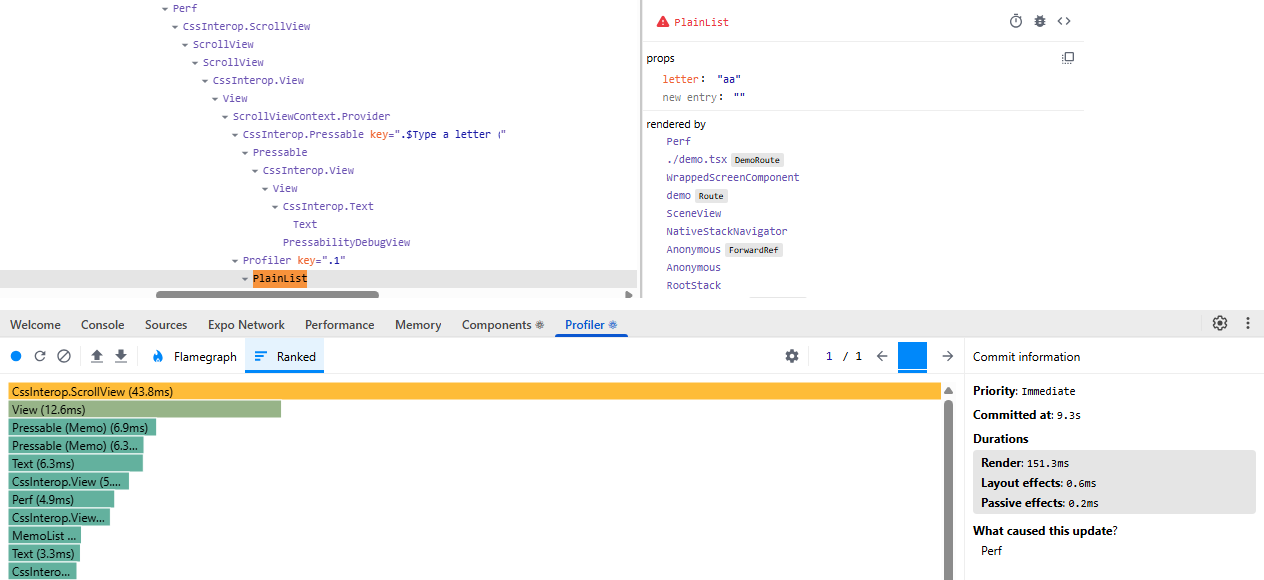
The tree is deeper than the code: NativeWind wraps each styled core component, so a ScrollView appears as CssInterop.ScrollView around ScrollView. That tap produced one commit, caused by Perf, which took 151 ms in this debug build on a busy emulator, 43.8 ms of it in CssInterop.ScrollView. The Flamegraph view grays out components that did not render, the quickest way to spot a memoized subtree that rendered anyway, and "Record why each component rendered while profiling", under the gear icon, says why.